E-mail Alert
 RSS
RSS-
Abstract
Quantitative detection of trace small-sized nanoplastics (<100 nm) remains a significant challenge in surface-enhanced Raman scattering (SERS). To tackle this issue, we developed a hydrophobic CuO@Ag nanowire substrate and introduced a multiplex-feature analysis strategy based on the coffee ring effect. This substrate not only offers high Raman enhancement but also exhibits a high probability of detection (POD), enabling rapid and accurate identification of 50 nm polystyrene nanoplastics over a broad concentration range (1–10−10 wt%). Importantly, experimental results reveal a strong correlation between the coffee ring formation and the concentration of nanoplastic dispersion. By incorporating Raman signal intensity, coffee ring diameter, and POD as combined features, we established a machine learning-based mapping between nanoplastic concentration and coffee ring characteristics, allowing precise predictions of dispersion concentration. The mean squared error of these predictions is remarkably low, ranging from 0.21 to 0.54, representing a 19 fold improvement in accuracy compared to traditional linear regression-based methods. This strategy effectively integrates SERS with wettability modification techniques, ensuring high sensitivity and fingerprinting capabilities, while addressing the limitations of Raman signal intensity in accurately reflecting concentration changes at ultra-low levels, providing a new idea for precise SERS measurements of nanoplastics.
Keywords
-
Introduction
Plastic products bring great convenience to people's lives, while plastic waste is also posing a serious threat to human health1,2. It is estimated that annually, between 4.8 and 12.7 million metric tons of plastic waste are discharged into aquatic environments, and this is expected to increase to about 12 billion metric tons by 20503, becoming one of the most serious environmental issues we face today. Nanoplastics, one type of plastic waste, typically measure less than 1 μm in size4. Compared to larger plastic waste, nanoplastics can more easily penetrate cell membranes and are more likely to adsorb various pollutants on their surface (e.g. persistent organic pollutants)4−6, thus exhibiting stronger biotoxicity. There are many methods for detecting nanoplastics, including transmission/scanning electron microscopy7, dynamic light scattering8, nanoparticle tracking analysis9, etc. However, all these methods cannot simultaneously provide information on the chemical composition and morphology of nanoplastics, which poses many inconveniences in practical applications. Surface-enhanced Raman scattering (SERS) can not only accurately reflect the chemical bond information of the nanoplastics but also enables high-resolution imaging of their morphology6,10, thus receiving extensive attention in the field of nanoplastic detection.
Currently, the biggest challenge in nanoplastic detection using SERS is how to precisely quantify trace nanoplastics11-13, which is actually a challenge for other anayltes as well11,14−16. The concentration of nanoplastics in real aquatic environments is low, typically in the µg/L range10,17, and the detection sensitivity of general SERS substrates often fails to meet practical needs. To enhance the detection sensitivity of SERS substrates for nanoplastics, researchers have explored various modifications to the surface structure of the substrates, including commercial Klarite structure18, 'particle in cavity' structure19, and silver nanowire membrane10, etc. Although these SERS substrates have achieved accurate identification of trace, even single nanoplastic particles, they still cannot quantify nanoplastics at lower concentrations. This is mainly because at low concentrations, nanoplastics are more sparsely distributed on the substrate surface, with distances between adjacent nanoplastics exceeding the diameter of the detection laser spot. When detecting at different low concentrations, the number of nanoplastics within the laser spot area remains similar, resulting in minimal differences in Raman spectral intensity. Therefore, quantitative analysis methods based on changes in peak signal intensity with concentration are not applicable. Additionally, at very low concentrations, due to the scarcity of nanoplastics, rapidly and accurately locating nanoplastics over a large detection area is also quite challenging. The use of colloid aggregation methods can effectively address these issues13,20: By adding an aggregating agent to a mixture solution of nanoplastic and nanometal colloid, aggregation can be induced due to the loss of surfactant on nanometal. On one hand, aggregates enrich the concentration of nanoplastics, avoiding issues of similar nanoplastic numbers in the detection area at low concentrations; on the other hand, this method allows more plasmonic hotspots to cover the nanoplastics, effectively enhancing the detected Raman spectral intensity. Thus, effective quantification of nanoplastics at various low concentrations is possible. However, precisely controlling the micro-morphology of nanometal colloids and the distribution of nanometal colloids around the nanoplastics within aggregates is challenging8,13,21, easily resulting in significant variations in hotspot distribution within the aggregates and poor reproducibility in detection, making precise quantification of trace nanoplastics difficult. Therefore, precise quantification of nanoplastics at low concentrations remains an unresolved issue.
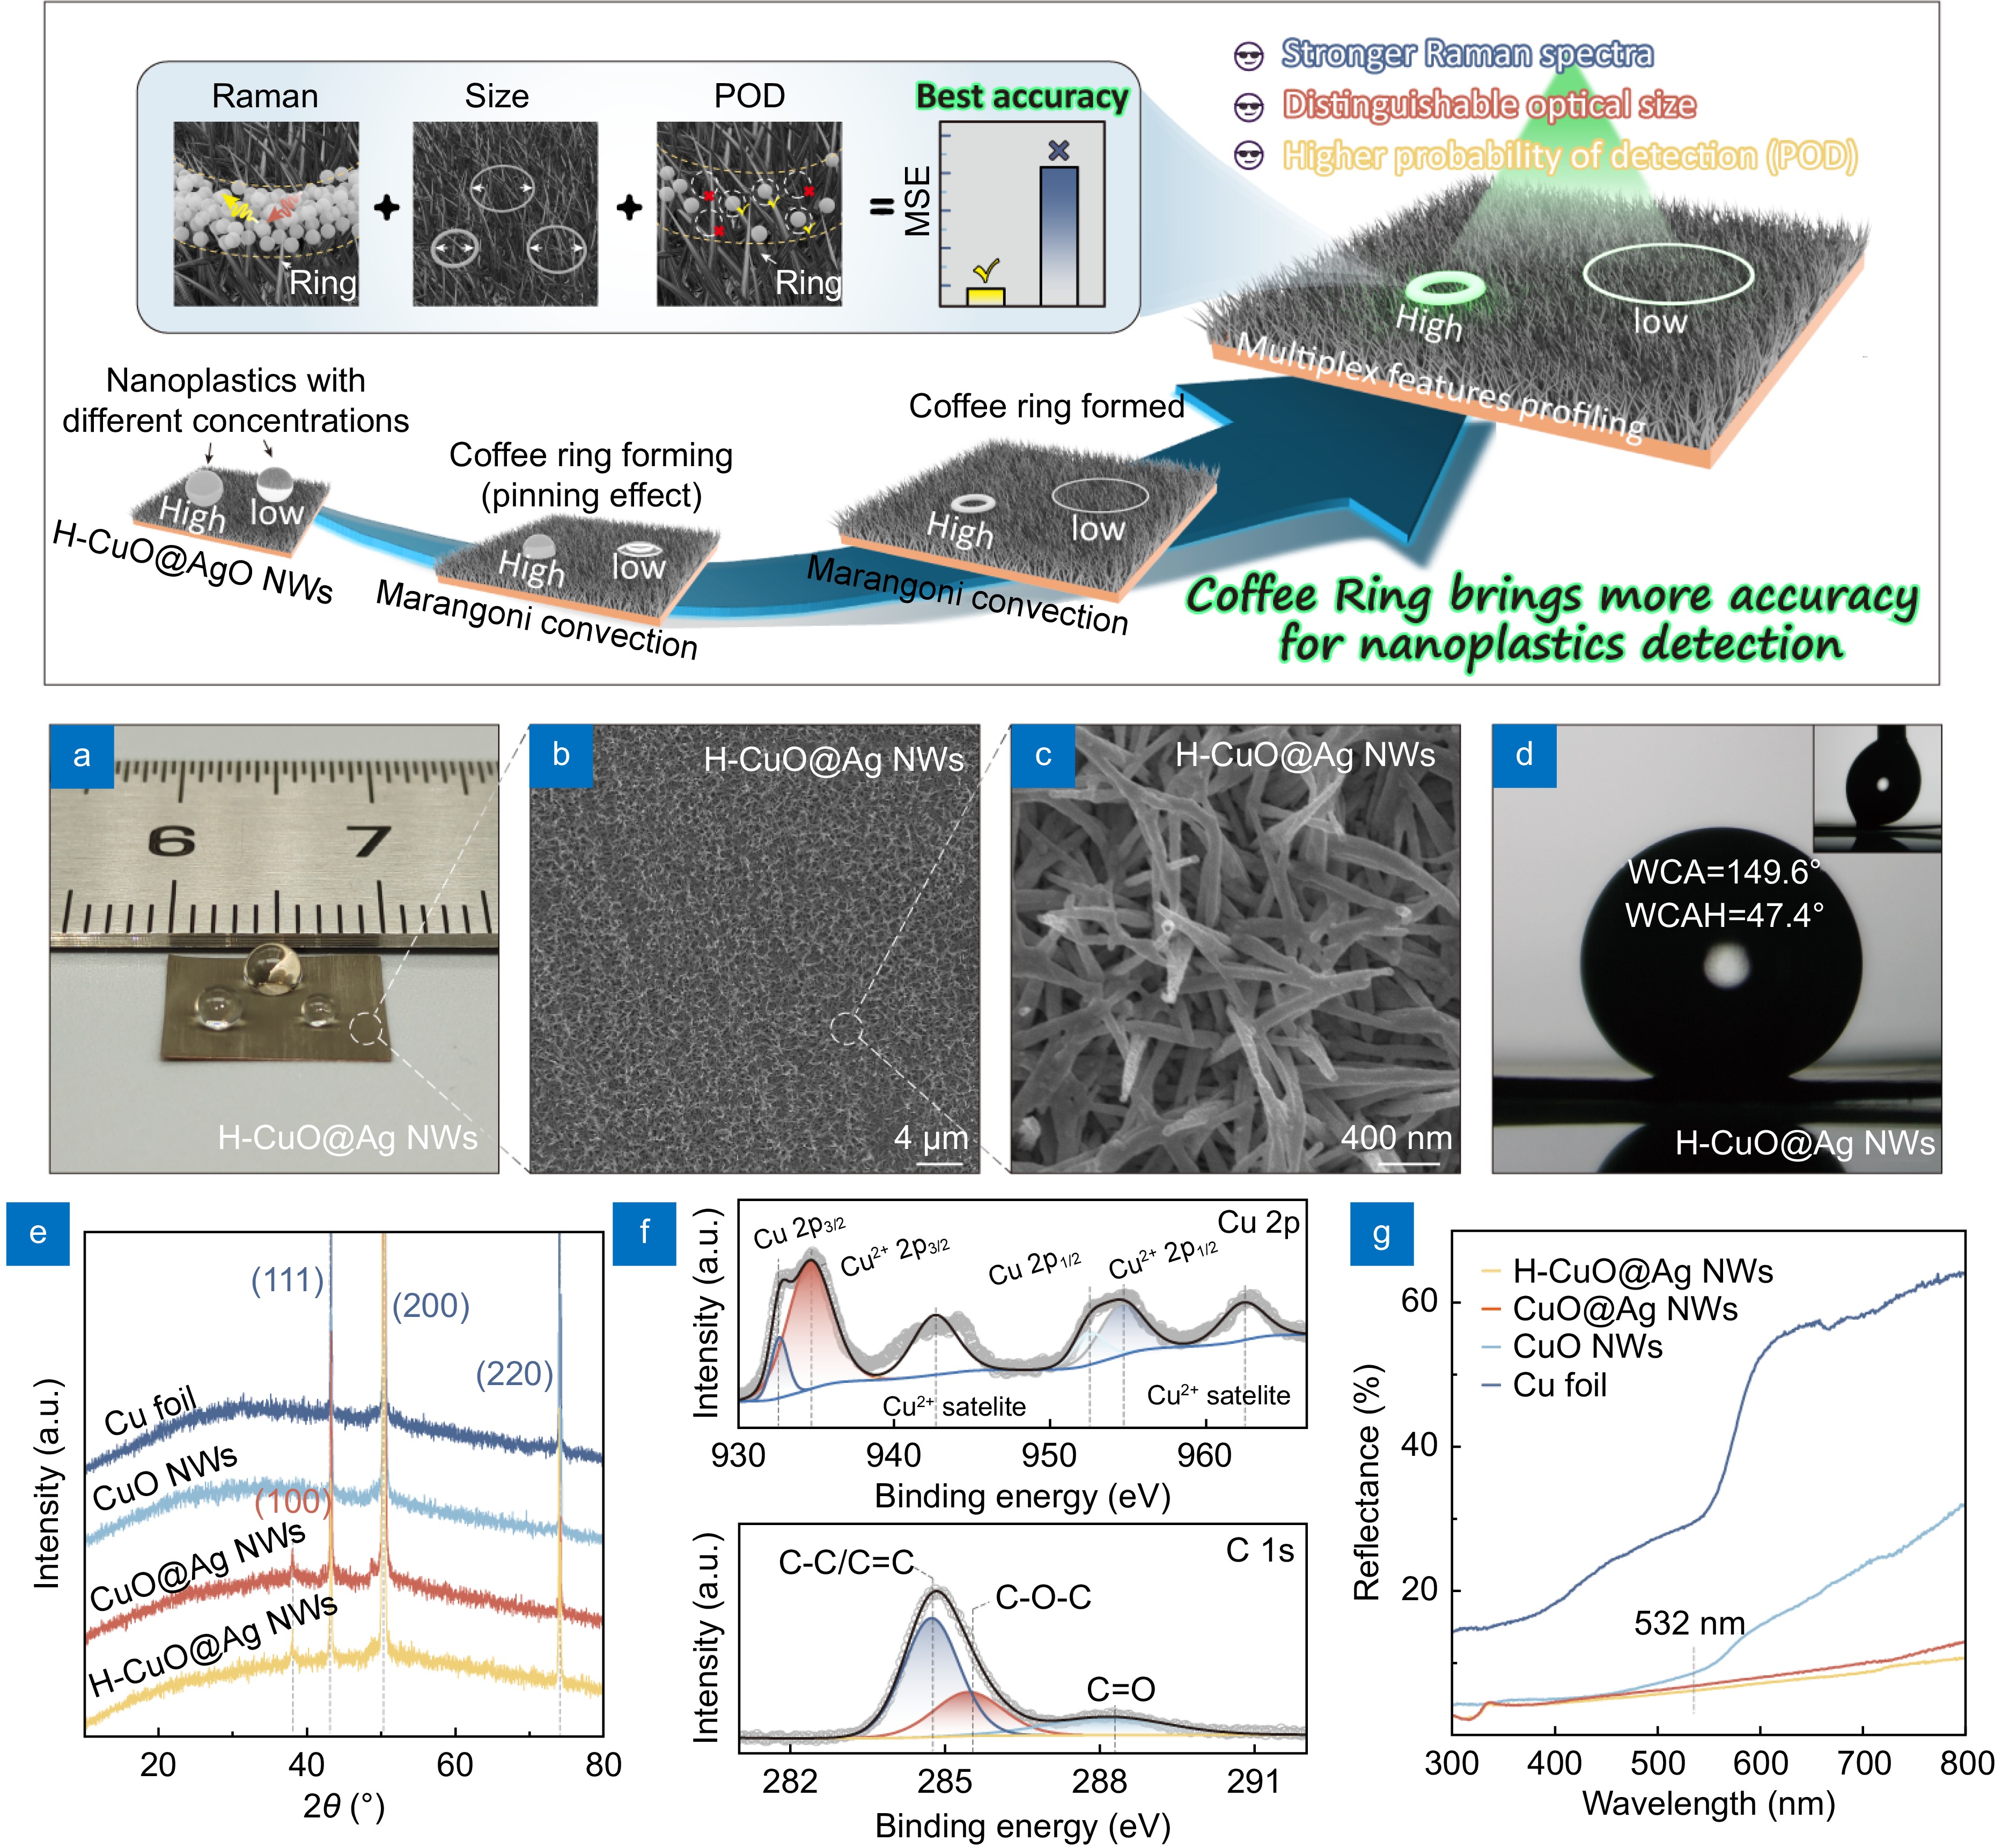
In response to the aforementioned issues, we propose a novel detection strategy based on the coffee ring effect in this work: Experimentally, we first prepared a sensitive SERS structure of hydrophobic CuO@Ag nanowires (H-CuO@Ag NWs) to generate the coffee ring effect. When a droplet containing nanoplastics is dropped onto this structure, the Marangoni flow within the droplet will move the 'coffee particles' (nanoplastics) to the edge of the droplet, forming a distinct coffee ring upon drying. Due to the pinning effect, nanoplastics will be ultimately enriched within the coffee ring, thereby mitigating the issue of insufficient Raman detection intensity due to excessive dispersion of nanoparticles at low concentrations. According to known results, the formation of the coffee ring and the concentration of the 'coffee particles' inside it are closely related22,23. In this work, we found that the inner diameter of the coffee ring on the substrate surface is inversely related to the concentration of nanoplastics in the droplet. Moreover, due to the enrichment effect of the coffee ring, even at low concentrations of nanoplastics, we can perform mapping scans in a smaller detection area and collect more effective Raman spectral information. We found that the probability of detection (POD) of effective Raman spectra in the detection area is positively related to the concentration of nanoplastics as well, which is also essentially known as a digitalization process now11,14,16. Therefore, at low concentrations, not only can we determine the nanoparticles' chemical information through enhanced Raman spectrum, but we can also analyze their concentration further through the size of the coffee ring and the POD of Raman signal within the ring. In other words, this strategy provides more information on the detection of nanoplastics, rather than merely enhancing the signal (as illustrated by the schematic in Fig. 1). Building on this, further utilizing multiplex-feature machine learning analysis to re-integrate and analyze these three different features (signal intensity, coffee ring diameter, POD), we found that within the concentration range of 1 to 10−10 wt%, the mean squared error (MSE) of the polystyrene (PS) nanoplastic (50 nm) concentration measurements obtained through multiplex-feature analysis between the actual values was only 0.21–0.54, which is ca. 19 times better than the results obtained through linear regression analysis based solely on changes in peak intensity. Besides, the minimum quantitative limit of detection (LOD) was also lowered to 10−10 wt%, which is lower than many values previously reported. As a proof of concept, we simulated the irrigation process of crops, and semi-quantitatively analyzed the generation of nano-sized polyvinyl chloride (PVC) during this process due to the collision between sediment and plastic pipe via this method. This work is the first time to precise-quantitatively detect trace PS nanoplastics with size down to 50 nm via SERS method, also having important reference value for accurate measurement of other nanoplastics.
![Figure 1. Schematic: coffee ring on H-CuO@Ag NWs brings more information for nanoplastic detection. (a) Optical photograph of H-CuO@Ag substrate with size of 1 × 1 cm2. (b, c) SEM images of H-CuO@Ag NWs under different magnifications. (d) WCA and WCAH of H-CuO@Ag substrate. (e) XRD patterns of different samples. (f) XPS high-resolution spectra of Cu 2p and C 1s of H-CuO@Ag NWs. (g) Reflectance of different samples.]() Schematic: coffee ring on H-CuO@Ag NWs brings more information for nanoplastic detection. (a) Optical photograph of H-CuO@Ag substrate with size of 1 × 1 cm2. (b, c) SEM images of H-CuO@Ag NWs under different magnifications. (d) WCA and WCAH of H-CuO@Ag substrate. (e) XRD patterns of different samples. (f) XPS high-resolution spectra of Cu 2p and C 1s of H-CuO@Ag NWs. (g) Reflectance of different samples.
Schematic: coffee ring on H-CuO@Ag NWs brings more information for nanoplastic detection. (a) Optical photograph of H-CuO@Ag substrate with size of 1 × 1 cm2. (b, c) SEM images of H-CuO@Ag NWs under different magnifications. (d) WCA and WCAH of H-CuO@Ag substrate. (e) XRD patterns of different samples. (f) XPS high-resolution spectra of Cu 2p and C 1s of H-CuO@Ag NWs. (g) Reflectance of different samples.Results and discussion
Characterizations of the H-CuO@Ag NWs
To ensure that the droplet of nanoplastic dispersion (10 μL) have sufficient spreading area on the substrate surface to form a coffee ring, we selected a 1 × 1 cm2 H-CuO@Ag NWs substrate for subsequent experiments. The optical photograph of it is shown in Fig. 1(a). In previous studies, we have demonstrated that CuO@Ag NWs (Fig. 1(b) and 1(c)) not only possess excellent SERS properties but also feature a unique micro-nano hierarchical structure24,25. Therefore, when further modified with low-surface-energy components, they will exhibit outstanding hydrophobicity24. To ensure the uniform formation of coffee rings by nanoplastic dispersion on the substrate surface, we also performed surface modifications on the CuO@Ag NWs in this work. Here, we employed the infrared thermal radiation method to modify the substrate. After modification, the apparent water contact angle (WCA) of the H-CuO@Ag NWs was 149.6°, with a water contact angle hysteresis (WCAH) of about 47.4° (Fig. 1(d)). Compared to other conventional hydrophobic modification methods24,26−29, the advantage of the infrared thermal radiation method is that it not only does not introduce long-chain organic compounds (e.g., fluoroalkyl silane, 1-dodecanethiol, etc.) to the substrate surface, avoiding interference peaks during subsequent low-concentration nanoplastic Raman detection; but also is with very simple process. Figure S1, showing the Raman spectra of CuO@Ag NWs before and after radiation, demonstrates no significant changes, confirming the aforementioned facts. According to previous report, the hydrophobicity comes from the nonpolar group of C–C/C=C on surface of H-CuO@Ag NWs, due to the thermal decomposition of ambient airborne organic compounds30, which is also verified by the XPS spectra of the CuO@Ag NWs before and after radiation (Figs. 1(f) and S2, more details are in Supporting information). Further analysis of the XRD patterns and reflectance spectra at different stages of substrate preparation (Fig. 1(e) and 1(g), more details are in Supplementary information) confirms that the hydrophobic modification does not affect the phase composition and optical properties of the CuO@Ag NWs. Additionally, the substrate exhibits a lower reflectance at 532 nm (< 6.7%), which corresponds to the wavelength of the excitation laser used subsequently, indicating a high light utilization by the substrate.
SERS performance of H-CuO@Ag NWs
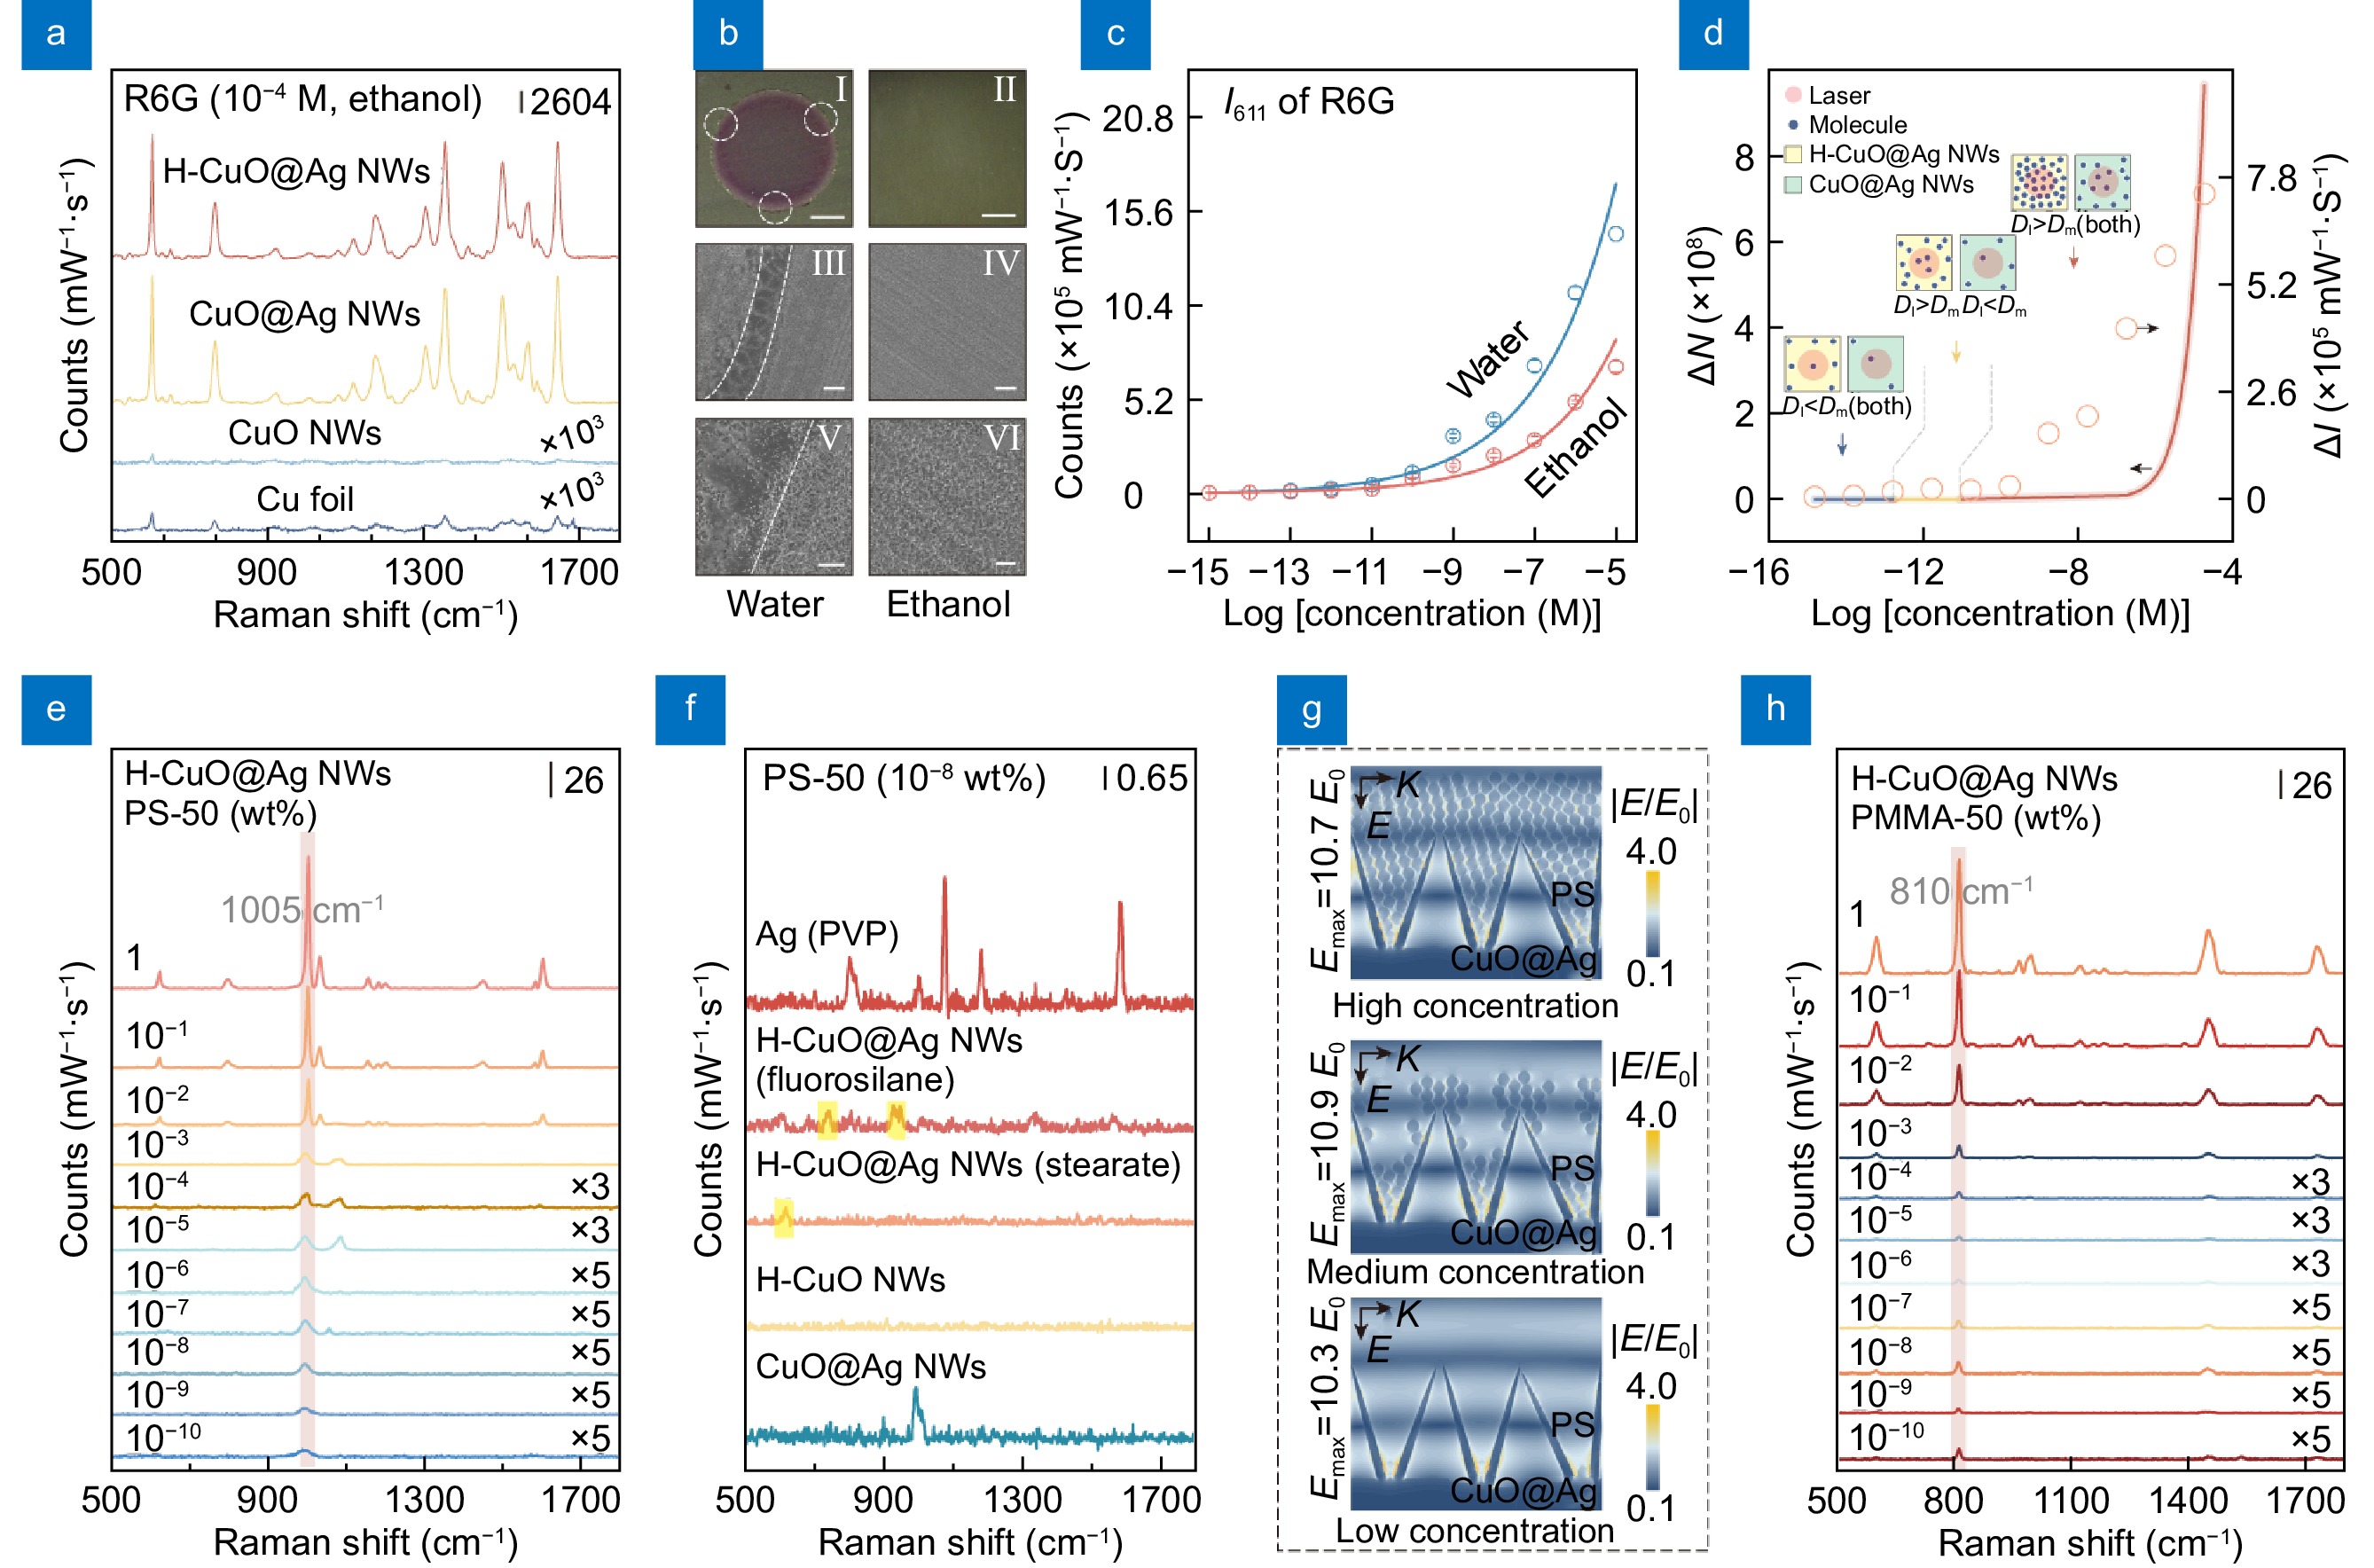
Figure 2(a) presents the Raman spectra of Rhodamine 6G (R6G, 10−4 M) collected from different substrates. It can be observed that, compared to Cu foil and CuO NWs, CuO@Ag NWs exhibit better Raman enhancement, with an enhancement factor of approximately 1.81×10⁶. To assess the potential impact of hydrophobic treatment on the intrinsic Raman enhancement of CuO@Ag NWs, anhydrous ethanol was selected as the R6G solvent in our tests. Due to ethanol's low surface tension (ca. 2.23 × 10⁻² N·m−1), it can form a uniform wetting state (CA<10°, Fig. S3) on both CuO@Ag NWs and H-CuO@Ag NWs surfaces when dropped onto them. Figure 2(a) shows that when ethanol is used as the solvent, the Raman spectra of R6G collected from the surfaces of H-CuO@Ag NWs and CuO@Ag NWs are almost identical, indicating that the hydrophobic treatment has no effect on the intrinsic Raman enhancement of CuO@Ag NWs. However, when water is used as the solvent, the high WCA and WCAH of H-CuO@Ag NWs cause water droplets to form a pronounced coffee ring on their surface, as shown in Fig. 2(b). This coffee ring effect concentrates the R6G molecules within the ring, increasing the amount of analyte within the detection laser spot, thereby further enhancing the detection sensitivity of H-CuO@Ag NWs. Figure 2(c) illustrates the variation in the intensity of the characteristic peak 611 cm−1 of R6G molecules (I611) when water and ethanol are used as solvents, respectively. It can be observed that within the concentration range of 10−5 to 10−12 M, the coffee ring effect exhibits a better Raman enhancement. To quantitatively show this phenomenon, taking ΔI = Iwater−Iethanol (take peak 611 cm−1 as example), it can be observed that as the concentration of R6G decreases, the value of ΔI gradually diminishes (Fig. 2(d)). Moreover, when the concentration of R6G is between 10−13 to 10−15 M, ΔI is almost zero. The primary reason for above phenomena is that, ideally, as the molecular concentration decreases, the number of molecules within the laser spot diminishes synchronously under both the coffee ring and the hydrophilic modes, with a more significant reduction observed in the coffee ring mode. However, when the molecular concentration decreases to a certain level such that the distance between adjacent molecules exceeds the diameter of the laser spot (Dl < Dm), the number of molecules within the laser spot under both the coffee ring and the hydrophilic modes becomes nearly identical (as cartooned in Fig. 2(d)). Consequently, the resulting Raman spectral intensities are approximately the same. From the other side, Raman intensity I is proportional to molecule number N, thus in our experiment, we further theoretically estimated the number difference of molecules ΔN, defining it as ΔN = Nwater−Nethanol (more details are in Supplementary information), as depicted in Fig. 2(d). It can be observed that the variation trend of ΔN with R6G concentration closely resembles the experimental ΔI. Within the concentration range of 10−5 to 1.02×10⁻¹³ M, the coffee ring mode exhibits more molecule numbers within laser spot. When the R6G concentration is below 1.02×10⁻¹³ M, the coffee ring mode and the hydrophilic mode demonstrate similar effects. Because Raman intensity I is proportional to molecule number N, the trend of ΔN, to a highly degree, verifies the aforementioned inference about ΔI.
![Figure 2. (a) Raman spectra of R6G collected from different substrates. (b) Coffee ring and hydrophilic modes: (I, II) optical images and (III-VI) SEM images of the stain of R6G droplets on H-CuO@Ag substrates. The scale bars in (I, II), (III, IV) and (V, VI) are respectively 1 mm, 10 μm and 2 μm. (c) Intensity changes of peak 611 cm−1 obtained respectively from coffee ring mode and hydrophilic mode. (d) Changes of ΔI and ΔN with different concentrations of R6G. (e) Raman spectra of PS-50 collected from coffee ring on H-CuO@Ag NWs. (f) Raman spectra of PS-50 collected from different substrates. (g) Simulated electric filed distributions in CuO@Ag NWs, with different concentrations of PS-50. (h) Raman spectra of PMMA-50 collected from coffee ring on H-CuO@Ag NWs.]() (a) Raman spectra of R6G collected from different substrates. (b) Coffee ring and hydrophilic modes: (I, II) optical images and (III-VI) SEM images of the stain of R6G droplets on H-CuO@Ag substrates. The scale bars in (I, II), (III, IV) and (V, VI) are respectively 1 mm, 10 μm and 2 μm. (c) Intensity changes of peak 611 cm−1 obtained respectively from coffee ring mode and hydrophilic mode. (d) Changes of ΔI and ΔN with different concentrations of R6G. (e) Raman spectra of PS-50 collected from coffee ring on H-CuO@Ag NWs. (f) Raman spectra of PS-50 collected from different substrates. (g) Simulated electric filed distributions in CuO@Ag NWs, with different concentrations of PS-50. (h) Raman spectra of PMMA-50 collected from coffee ring on H-CuO@Ag NWs.
(a) Raman spectra of R6G collected from different substrates. (b) Coffee ring and hydrophilic modes: (I, II) optical images and (III-VI) SEM images of the stain of R6G droplets on H-CuO@Ag substrates. The scale bars in (I, II), (III, IV) and (V, VI) are respectively 1 mm, 10 μm and 2 μm. (c) Intensity changes of peak 611 cm−1 obtained respectively from coffee ring mode and hydrophilic mode. (d) Changes of ΔI and ΔN with different concentrations of R6G. (e) Raman spectra of PS-50 collected from coffee ring on H-CuO@Ag NWs. (f) Raman spectra of PS-50 collected from different substrates. (g) Simulated electric filed distributions in CuO@Ag NWs, with different concentrations of PS-50. (h) Raman spectra of PMMA-50 collected from coffee ring on H-CuO@Ag NWs.Raman detection of nanoplastics by H-CuO@Ag NWs
Based on the above results, we attempted to utilize the coffee ring mode of H-CuO@Ag NWs to detect nanoplastics, selecting 50 nm PS nanoplastics (PS-50) as the probe in our experiments. Figure 2(e) illustrates that H-CuO@Ag NWs can sensitively detect PS-50 within a concentration range of 1 to 10−10 wt%, taking peak at 1005 cm−1 as a reference10,19. The LOD for PS-50 by H-CuO@Ag NWs can be approximately estimated to be around 10−10 wt% (for which the signal-to-noise ratio is ca. 6.3). Further tests were conducted using PS nanoplastics with sizes of 100 nm (PS-100), 200 nm (PS-200), and 300 nm (PS-300), yielding similar results (Fig. S4). These findings indicate that, in the coffee ring mode, H-CuO@Ag NWs exhibit high sensitivity for the detection of PS nanoplastics. By comparing the Raman spectra of PS nanoplastics collected from different substrates under different wetting modes (Fig. S5), and performing finite-difference time-domain (FDTD) analysis on CuO@Ag NWs (Figs. S6 and 2(g)), it can be demonstrated that the enhanced Raman signal of PS nanoplastics using H-CuO@Ag NWs is primarily attributable to two factors (more details are in Supporting information): (1) the enrichment of PS nanoplastics due to the coffee ring effect, leading to an increased number of analytes within the detection area; and (2) the intrinsic electromagnetic enhancement provided by CuO@Ag NWs. It is worth noting that although hydrophobic structures are often used to enrich trace analytes, they typically require modification with low surface energy substances31,32. This process frequently introduces interference peaks, which can affect the detection signal during trace analysis on the relevant substrates. As a verification, CuO@Ag NWs were modified with fluorosilane and stearate to obtain H-CuO@Ag NWs as well, also achieving a pronounced coffee ring effect (Fig. S7). However, when attempting to detect trace amounts of PS-50 (10−8 wt%), interference peaks (620 cm−1, 745 cm−1, 933 cm−1, etc.) were easily observed in the Raman spectra (Fig. 2(f)). On the other hand, when using hydrophilic CuO@Ag NWs to detect trace amounts of PS-50 (10−8 wt%), although a satisfactory Raman signal can be obtained (Fig. 2(f)), this process typically requires a higher number of measurements (in our case, >20), which is highly inconvenient for practical detection. However, the H-CuO@Ag NWs used in this study combine the aforementioned advantages, enriching the analyte and increasing the POD without introducing interference peaks. This is crucial for the subsequent quantitative analysis of trace nanoplastics. Furthermore, we attempted to detect 50 nm polymethyl methacrylate (PMMA-50) using H-CuO@Ag NWs. The results demonstrated that its characteristic peak at 810 cm−1 could be clearly observed across a concentration range from 1 to 10−10 wt% (Fig. 2(h)), proving that this structure has a certain advantage in the sensitive detection of trace nanoplastics.
Relationship between Raman intensity and concentration of nanoplastics
Furthermore, we investigated the relationship between the intensity of the PS-50 Raman characteristic peak and its concentration (CPS). Taking the peak at 1005 cm−1 (I1005) as an example, within the concentration range of 1 to 10−4 wt%, I1005 exhibits a strong linear correlation with CPS, with a regression coefficient (R2) of approximately 0.934 (Fig. 3(b)). However, at low concentrations (10−5 to 10−10 wt%), I1005 remains nearly unchanged with variations in CPS. Comparisons with the samples of PMMA-50 and PS-100/PS-200/PS-300 (Fig. S8) further confirms that the behavior of the intensity variation of the nanoplastic characteristic peaks is consistent with the above results. These phenomena indicate that when the concentration of nanoplastics is relatively high (1 to 10−4 wt%), H-CuO@Ag NWs can facilitate quantitative analysis of the nanoplastics. However, at low concentrations (10−5 to 10−10 wt%), the corresponding detection results are only suitable for qualitative analysis. This outcome is similar to the results obtained when using H-CuO@Ag NWs to detect R6G: at low analyte concentrations, the number of analyte within the laser spot becomes comparable across different concentrations, leading to a lack of positive correlation between the Raman characteristic peak intensity and analyte concentration. Nevertheless, this characteristic poses significant challenges for the accurate measurement of trace amounts of nanoplastics.
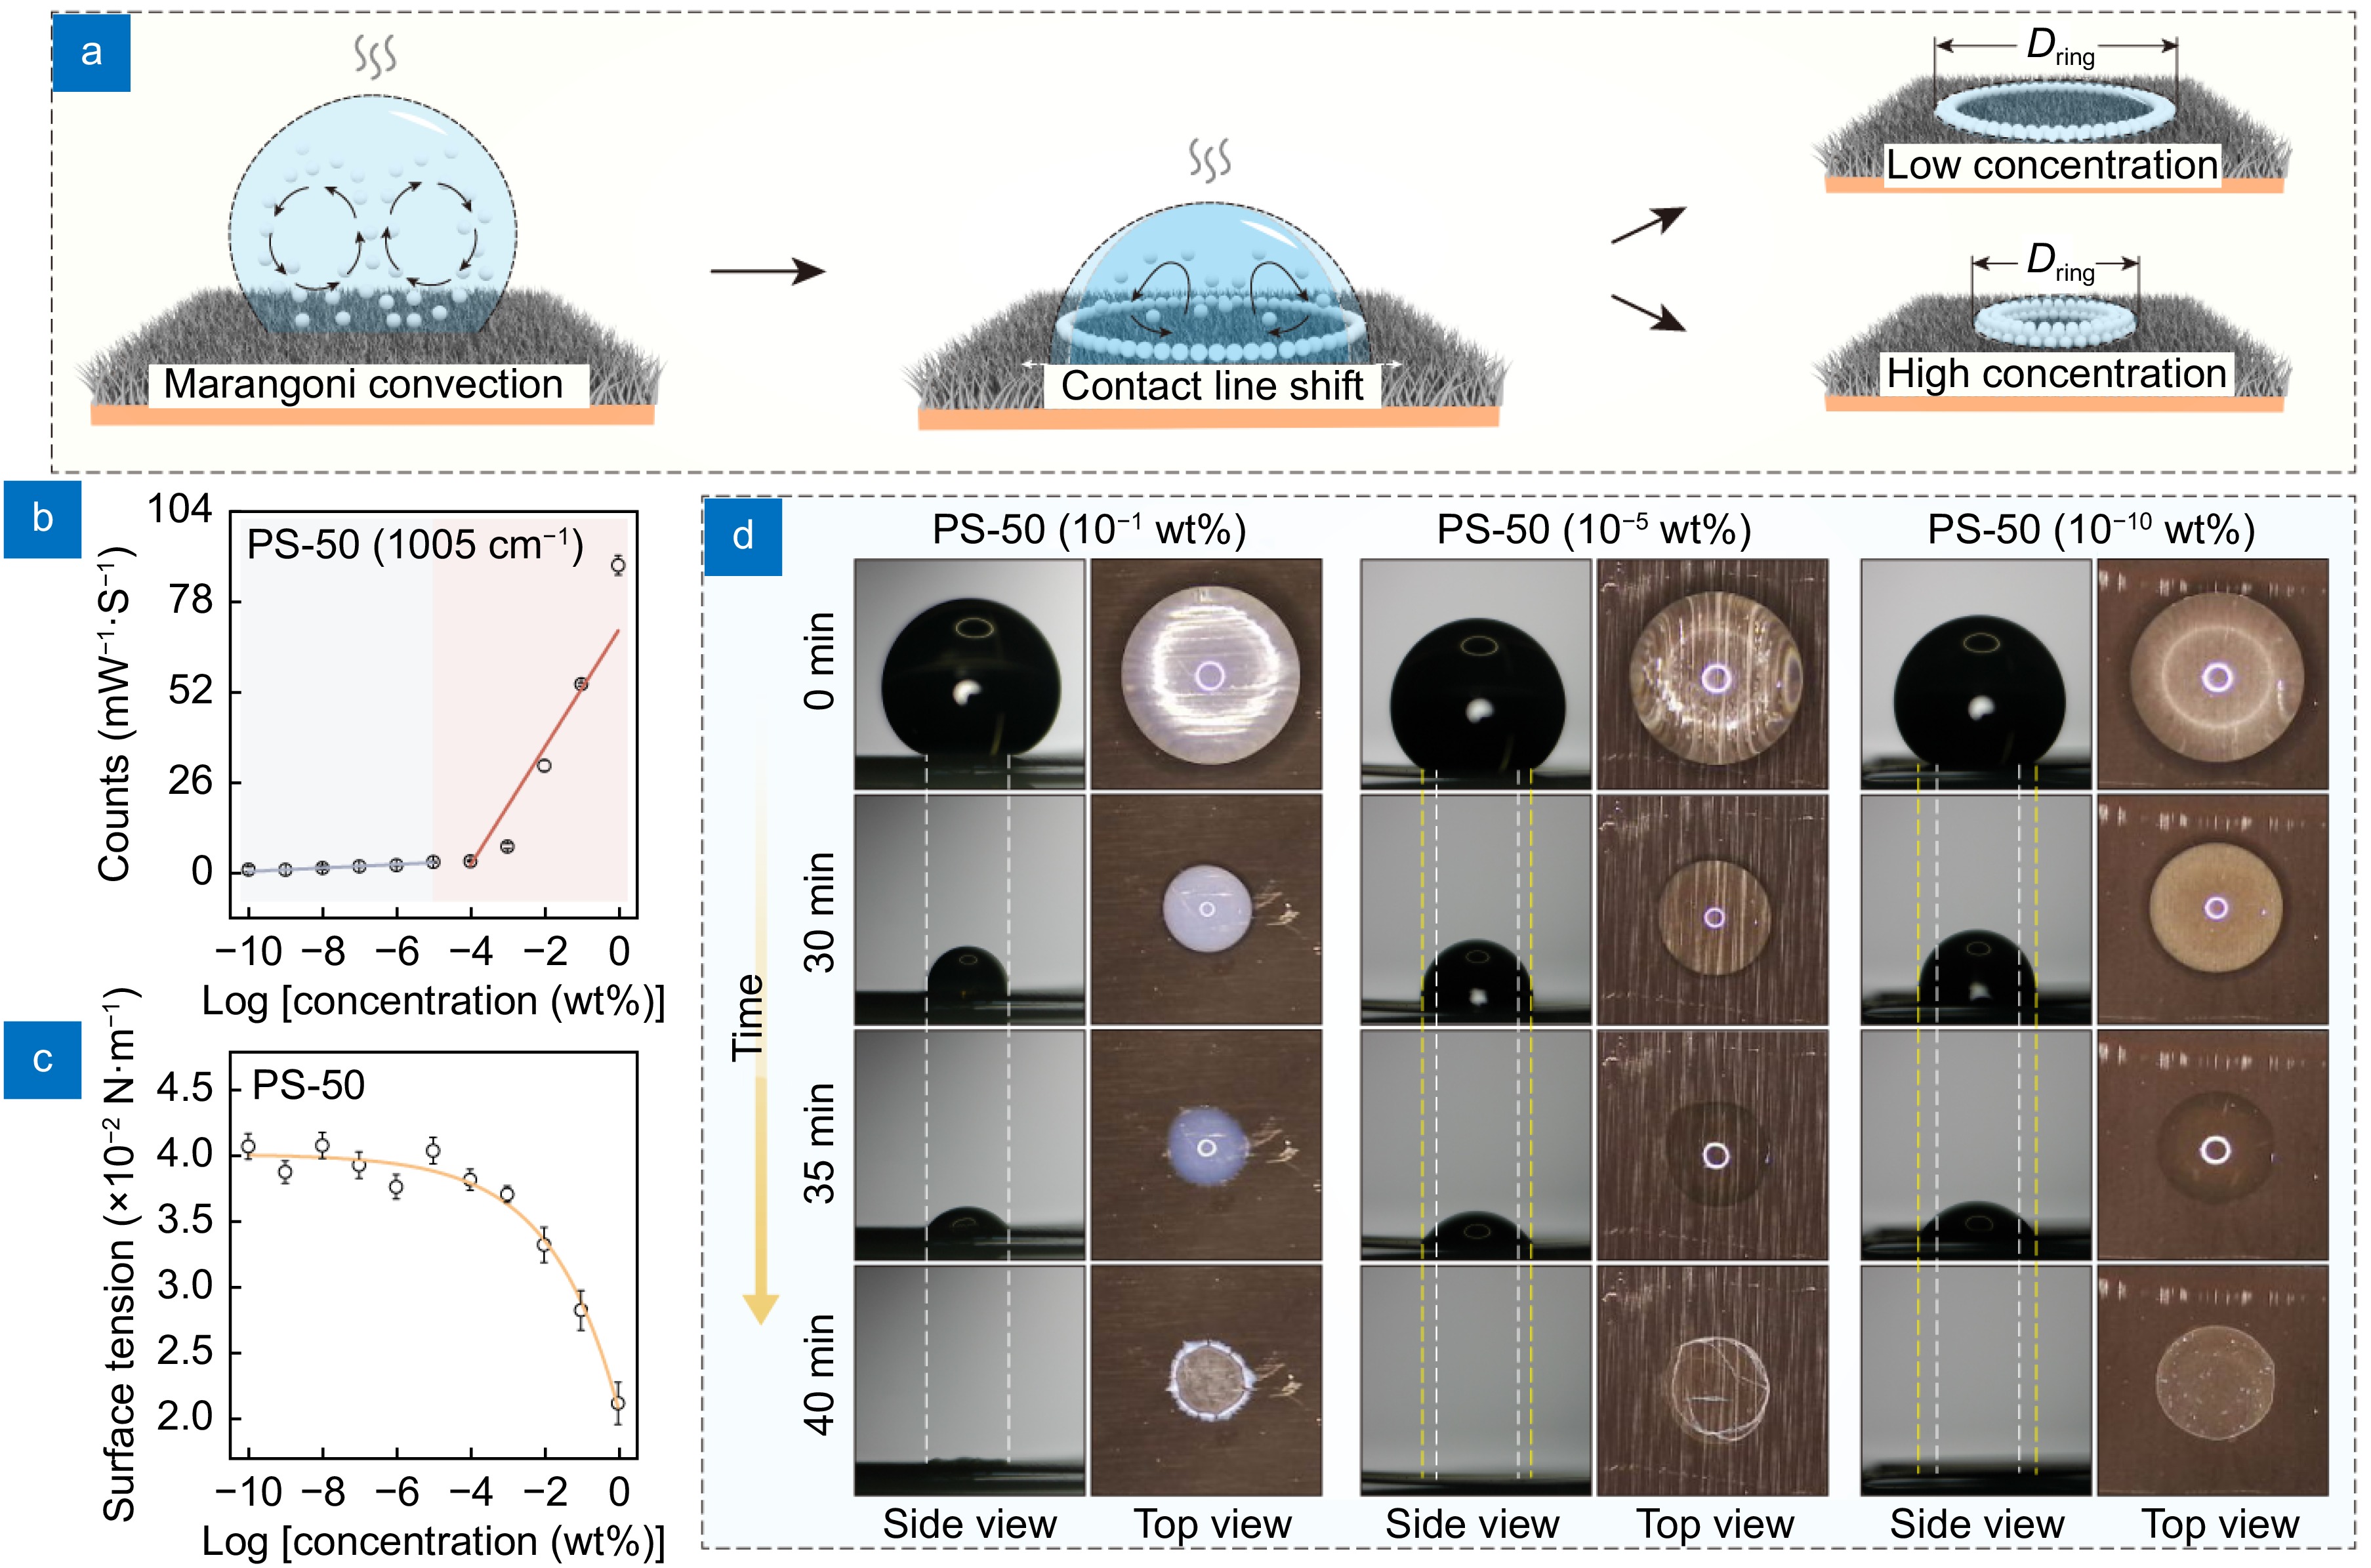
![Figure 3. (a) Schematic: position shifts of the 'gas-liquid-solid' three-phase contact line between the PS dispersion droplet and the substrate under different PS concentrations. (b) Correlation between the peak intensity of 1005 cm−1 and the PS-50 concentration. (c) Surface tension of PS-50 dispersions at varying concentrations. (d) Optical images of position shifts of the three-phase contact line during the evaporation for droplets of PS-50 dispersions with different concentrations.]() (a) Schematic: position shifts of the 'gas-liquid-solid' three-phase contact line between the PS dispersion droplet and the substrate under different PS concentrations. (b) Correlation between the peak intensity of 1005 cm−1 and the PS-50 concentration. (c) Surface tension of PS-50 dispersions at varying concentrations. (d) Optical images of position shifts of the three-phase contact line during the evaporation for droplets of PS-50 dispersions with different concentrations.
(a) Schematic: position shifts of the 'gas-liquid-solid' three-phase contact line between the PS dispersion droplet and the substrate under different PS concentrations. (b) Correlation between the peak intensity of 1005 cm−1 and the PS-50 concentration. (c) Surface tension of PS-50 dispersions at varying concentrations. (d) Optical images of position shifts of the three-phase contact line during the evaporation for droplets of PS-50 dispersions with different concentrations.Interestingly, in this study, the coffee ring effect formed by the H-CuO@Ag NWs not only serves as an enrichment method to enhance SERS detection sensitivity but also, the formation process of the coffee ring itself can be used as a feature to improve SERS quantification accuracy. As shown in Fig. 3(a), during the formation of the coffee ring, the position of the 'gas-liquid-solid' three-phase contact line between the PS dispersion droplet and the substrate shifts as the liquid evaporates33−35. Simultaneously, the Marangoni convection inside the droplet transports the 'coffee particles' (i.e., nanoplastic particles) to the three-phase contact line. As the number of 'coffee particles' at the contact line increases, a pinning effect occurs at the contact line, preventing further movement until the droplet fully evaporates, resulting in the formation of a coffee ring36. Therefore, the formation process of the coffee ring is closely related to the concentration of 'coffee particles' within the droplet. Figure 3(d) illustrates the changes in the position of the three-phase contact line during the evaporation for droplets of PS dispersions with high, medium, and low concentrations (10−1 wt%, 10−5 wt%, and 10−10 wt%), respectively. It can be observed that as the concentration of the dispersion decreases, the location where the pinning effect occurs gradually shifts outward, and correspondingly, the diameter of the coffee ring (Dring) increases. Figure 4(b1) presents the optical images of coffee rings formed on the H-CuO@Ag NWs surface from PS-50 dispersions of varying concentrations (1 to 10−10 wt%), showing an increase in the average Dring from 1.21 to 2.01 mm. To validate the accuracy of these conclusions, we conducted 20 experiments for PS-50 dispersions with different concentrations and measured the corresponding Dring. The results indicate that the average Dring increases as the PS concentration decreases (Fig. 4(b2)). On the other hand, the pinning effect of the material surface on PS particles is related to the surface energy of the PS particles. The lower the surface energy of PS, the more easily the pinning effect is formed; conversely, the higher the surface energy, the less likely the pinning effect is to occur37−39. Figure 3(c) illustrates the surface tension of PS-50 dispersions at varying concentrations, which are directly related to the surface energy of PS particles. It can be observed that the trend of surface tension change with PS concentration closely mirrors the trend of the average coffee ring diameter with PS concentration (Fig. 4(b2)), further corroborating the influence of nanoplastic concentration on the Dring from another perspective. Comparing Fig. 3(b) and Fig. 4(b2), it is evident that when the PS concentration is low (10−5 to 10−10 wt%), the prediction accuracy of PS concentration based on the regression equation between Dring and CPS is higher. However, within this concentration range, the change in Dring with respect to CPS is relatively gradual, with an average slope value of only 0.042, indicating that the regression equation has a lower prediction resolution for PS dispersions with similar concentrations in this range.
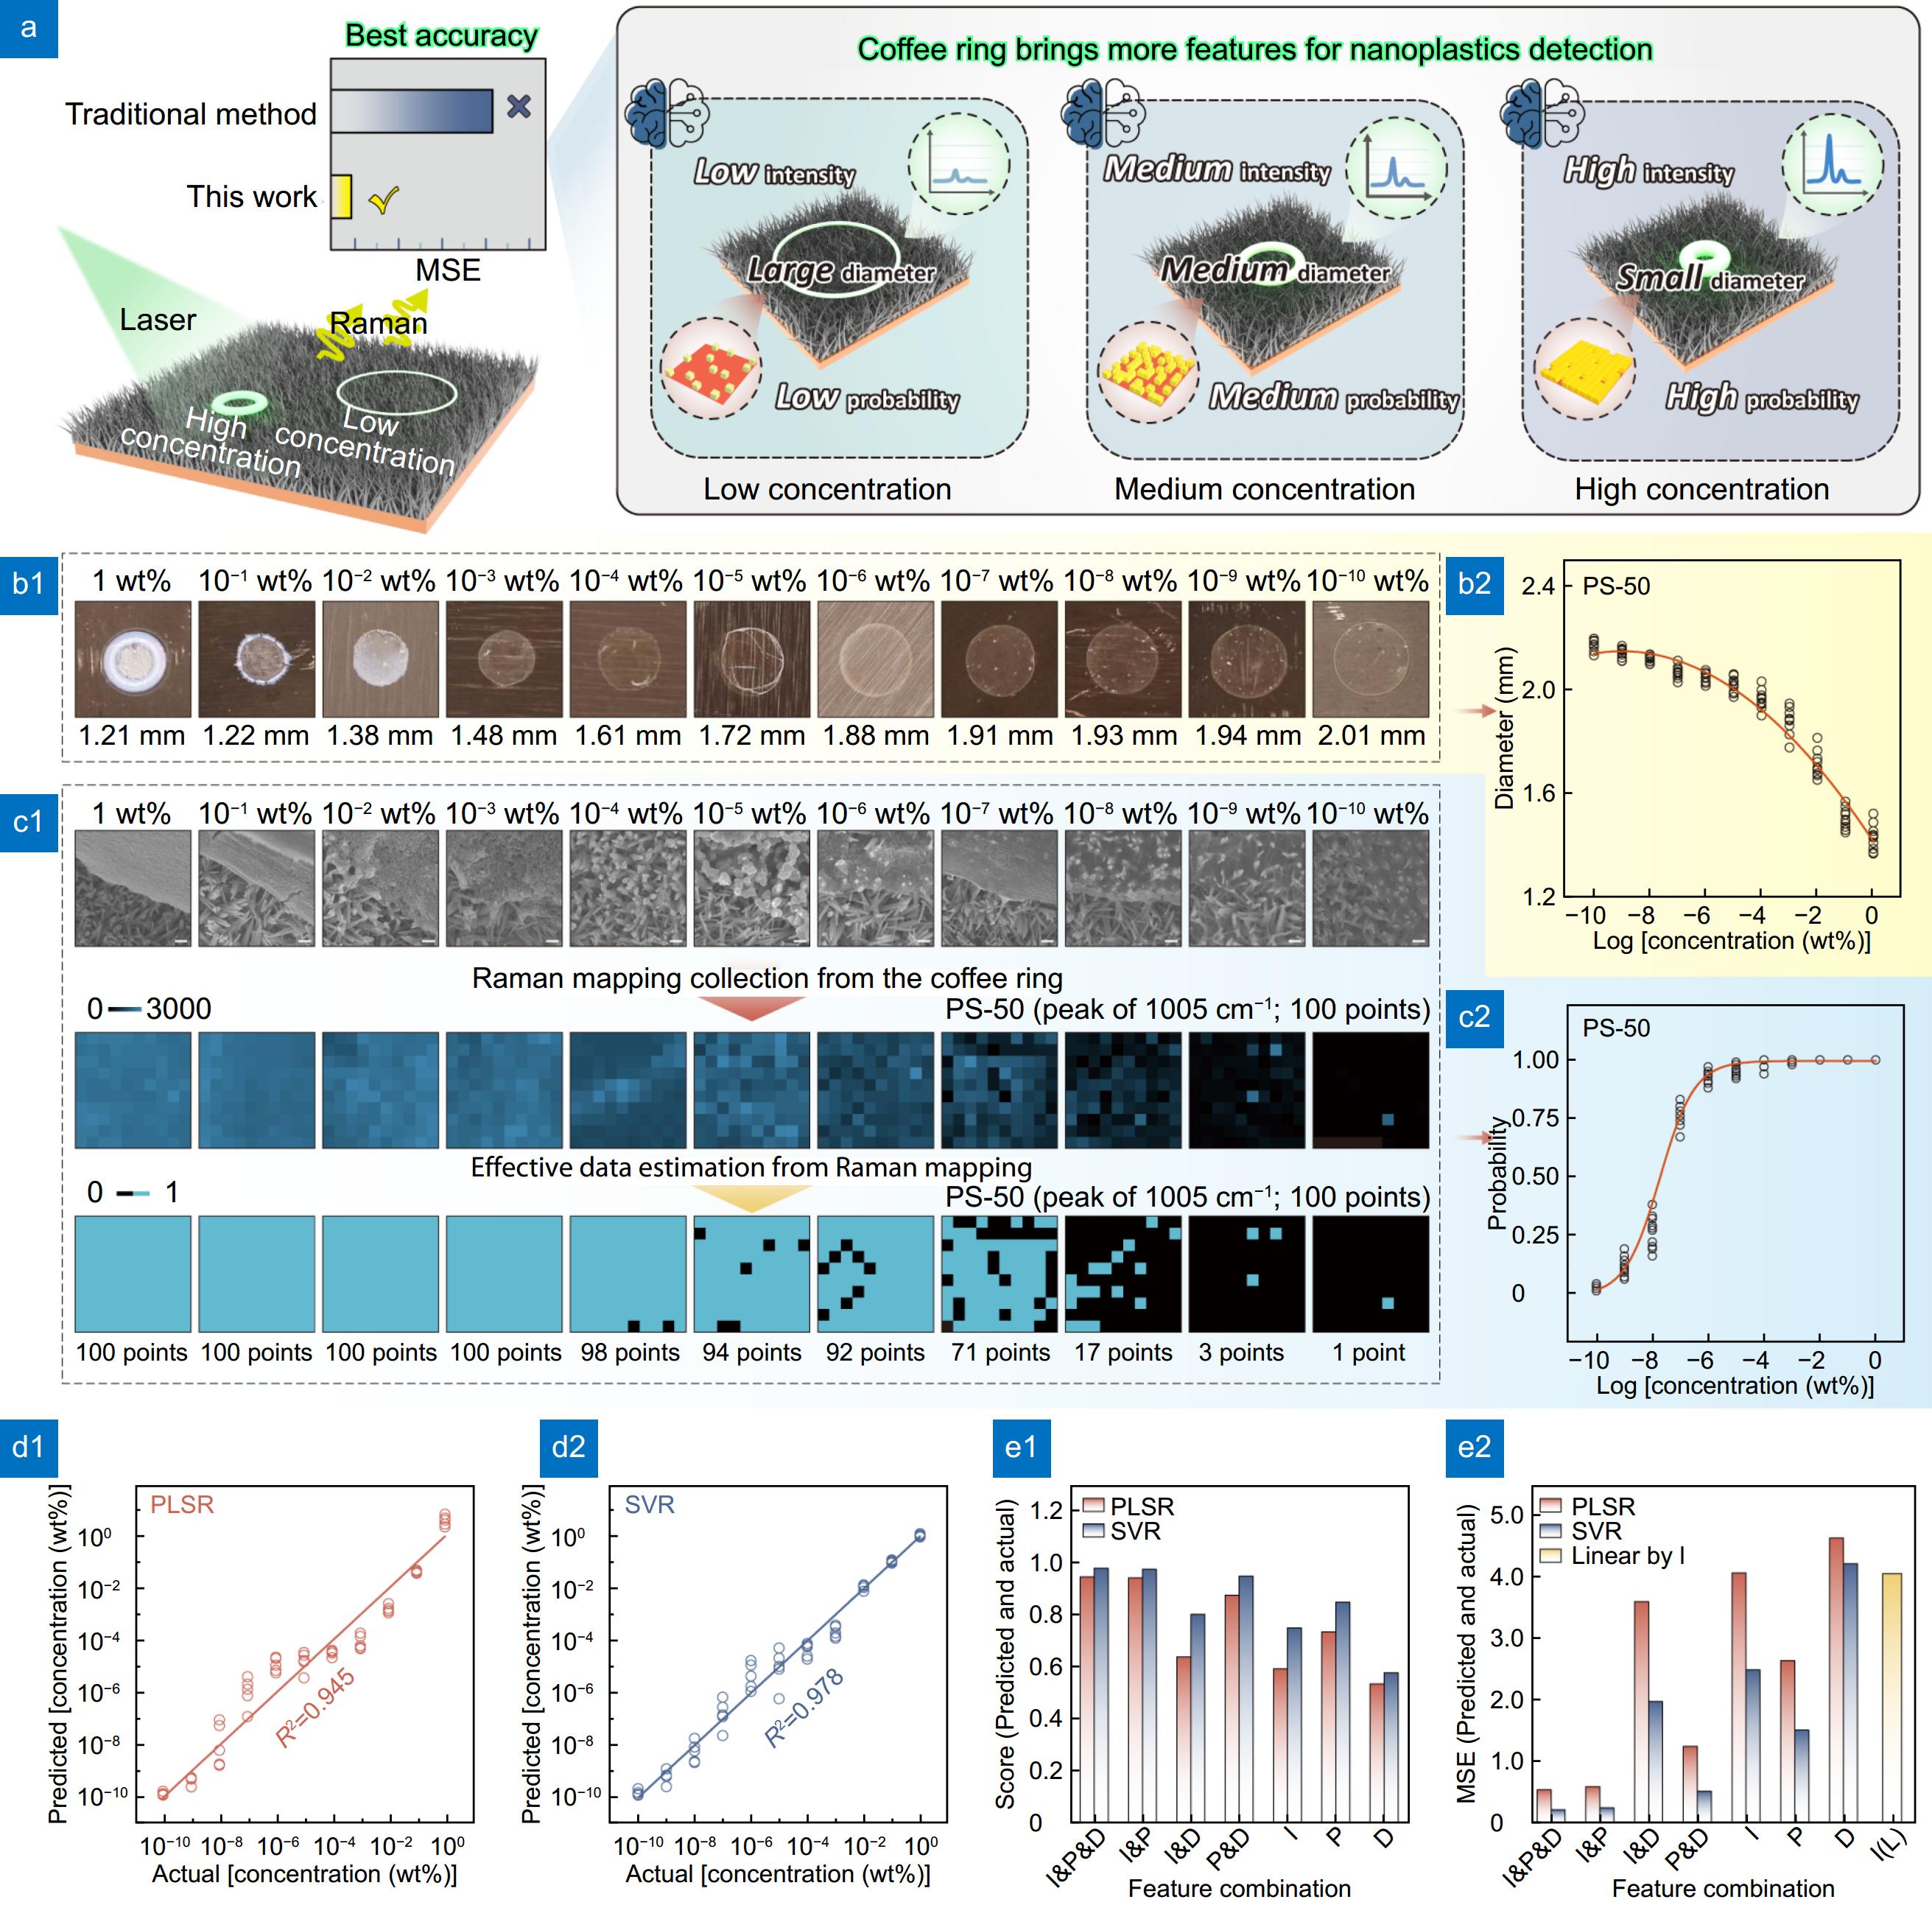
![Figure 4. (a) Schematic: more features brought by coffee ring for more accurate detection of nanoplastics. (b1) Optical images and (b2) changes of Dring formed by PS-50 dispersions with different concentrations on the H-CuO@Ag NWs surface. (c1) SEM images, Raman mappings and effective data estimation and (c2) POD of the PS-50 in the coffee ring. The scale bars in (c1) are all 400 nm. (d1, d2) Correlation between the predicted and actual values obtained from the PLSR model and the SVR model, respectively. (e1, e2) Score and MSE values of different feature combinations, which are obtained from PLSR model, SVR model and simple linear regression model, respectively.]() (a) Schematic: more features brought by coffee ring for more accurate detection of nanoplastics. (b1) Optical images and (b2) changes of Dring formed by PS-50 dispersions with different concentrations on the H-CuO@Ag NWs surface. (c1) SEM images, Raman mappings and effective data estimation and (c2) POD of the PS-50 in the coffee ring. The scale bars in (c1) are all 400 nm. (d1, d2) Correlation between the predicted and actual values obtained from the PLSR model and the SVR model, respectively. (e1, e2) Score and MSE values of different feature combinations, which are obtained from PLSR model, SVR model and simple linear regression model, respectively.
(a) Schematic: more features brought by coffee ring for more accurate detection of nanoplastics. (b1) Optical images and (b2) changes of Dring formed by PS-50 dispersions with different concentrations on the H-CuO@Ag NWs surface. (c1) SEM images, Raman mappings and effective data estimation and (c2) POD of the PS-50 in the coffee ring. The scale bars in (c1) are all 400 nm. (d1, d2) Correlation between the predicted and actual values obtained from the PLSR model and the SVR model, respectively. (e1, e2) Score and MSE values of different feature combinations, which are obtained from PLSR model, SVR model and simple linear regression model, respectively.Intensity, diameter and probability brought by the coffee ring, for nanoplastic detection
In fact, besides the correlation between I1005 and Dring with CPS, the POD of the PS characteristic peak within the coffee ring region (P) is also closely related to CPS. To illustrate this fact, we conducted the following experiment: first, we collected 100 independent data sets from different locations within the coffee rings formed by PS-50 dispersions at various concentrations, and presented the I1005 in a heat map, as shown in Fig. 4(c1). Subsequently, to assess whether PS particle was indeed detected at different locations, we compared I1005 at different positions with the detection threshold (Ithreshold). Considering that at low concentrations (10−5 to 10−10 wt%), the minimum Raman detection intensity of PS-50 by H-CuO@Ag NWs was ca. 0.71 counts/mW·s, we set this value as Ithreshold. Further, we compared the I1005 at different locations with the Ithreshold. If I1005 ≥ Ithreshold, then I1005 was set to 1, indicating that PS was detected at that location; otherwise, I1005 was set to 0, indicating that PS was not detected at that location. Finally, the heat map was redrawn, and the resulting data is shown in Fig. 4(c1). The results indicate that when CPS is high (1 to 10−4 wt%), almost all detection points within the mapping can detect the PS Raman signal. However, as CPS decreases (10−5 to 10−10 wt%), the number of signal points within decreases correspondingly. Furthermore, we conducted 20 independent tests on PS dispersions at different concentrations and calculated the P1005. The results show that within the low concentration range (10−5 to 10−10 wt%), P1005 decreases as CPS decreases (Fig. 4(c2)). Interestingly, unlike the relationship between I1005 and Cps or Dring and Cps, P1005 exhibits a more pronounced change within this range, with an average slope value of approximately 14. This indicates that P1005 is more sensitive for reflecting changes in low concentrations of PS, compared to I1005 or Dring. On the other hand, at high concentrations (1 to 10−4 wt%), P1005 remains almost unchanged with varying concentrations, suggesting that P1005 is not effective in reflecting changes in PS concentration in this range. The primary reason is the variation in the number of PS particles within the coffee ring detection area at different concentrations. The SEM images in Fig. 4(c1) display the distribution of PS-50 nanoparticles within the coffee ring across a concentration range from 1 to 10−10 wt%. It can be observed that at high concentrations (1 to 10−4 wt%), the ring is almost entirely filled with PS nanoparticles. However, as the concentration decreases, the distribution of PS nanoparticles within the ring becomes less continuous.
According to the results above, it can be concluded that while using the corresponding relationships between I, D, P, and C to predict unknown PS concentrations has its advantages and disadvantages, none of these methods can accurately predict PS concentration over a wide range, thus posing challenges for practical detection. However, considering this from another perspective, I, D, and P are all different characteristics of the coffee ring, each reflecting the mapping relationship between the coffee ring and the internal PS concentration from different angles. Therefore, if these three characteristics are treated as a whole and the mapping relationship between this integrated set of features and PS concentration is explored, it should theoretically provide a more accurate prediction of the concentration of unknown PS dispersions.
Based on this approach, we attempted to integrate and analyze the aforementioned features using machine learning algorithms. In this study, we employed two classical regression algorithms: partial least squares regression (PLSR) and support vector regression (SVR). Encouragingly, when I1005 (Fig. S9), Dring (Fig. 4(b2)) and P1005 (Fig. 4(c2)) are simultaneously selected as feature vectors, the score values for the two regression algorithms are 0.95 (PLSR) and 0.98 (SVR) respectively, across the whole concentration range from 1 to 10−10 wt% (Fig. 4(d1), 4(d2) and 4(e1)). Moreover, the MSE between the predicted and actual values is only 0.54 (PLSR) and 0.21 (SVR), as shown in Fig. 4(e2), indicating a high level of consistency between the predicted and actual values. As a control, we performed a simple linear regression analysis on I1005 and CPS, using the corresponding regression equations to predict the test samples. The results showed that the MSE between the predicted and actual values is 4.06 (Fig. 4(e2)). It can be seen that, compared to traditional analysis methods, the improved analytical method can increase the prediction accuracy by up to 19 times. Furthermore, if we reduce the number of feature vectors and select only two or one from I1005, Dring and P1005 to repeat the aforementioned experiments, the results indicate varying degrees of decrease in the score values and increase in the MSE (Fig. 4(e1) and 4(e2)), suggesting a decline in prediction accuracy. Therefore, although the different features I1005, Dring and P1005 induced by the coffee ring effect can each reflect changes in the internal PS concentration, only their effective combination can yield the most accurate prediction results.
Detection of PVC nanoplastic produced during irrigation process for crops
It should be noted that the formation of coffee ring is influenced by various factors such as the size and density of the 'coffee particles' within the dispersion, the wettability of the substrate, and the solvent properties40−42. Consequently, when using the aforementioned machine learning models to predict the concentration of nanoplastics, these constraints must be taken into account. Therefore, further exploration of machine learning models that are suitable for different types of nanoplastics is still necessary. However, in certain specific cases, the above models can also be applied for semi-quantitative analysis of some nanoplastics. For example, nano-sized PVC particles (<100 nm) are common nanoplastic pollutants in the environment6,12. However, due to the lack of model samples in experiments, effective analytical models have not yet been established. Currently, Raman or SERS-based PVC analysis mainly focuses on larger PVC microparticles, while studies on small-sized PVC nanoparticles remain scarce and are all qualitative in nature43−45. However, due to the similar densities of PVC and PS46, when the two materials have the same particle size and are dispersed in the same solution, the machine learning model trained on PS nanoplastics in this study can also be applied for the semi-quantitative analysis of PVC.
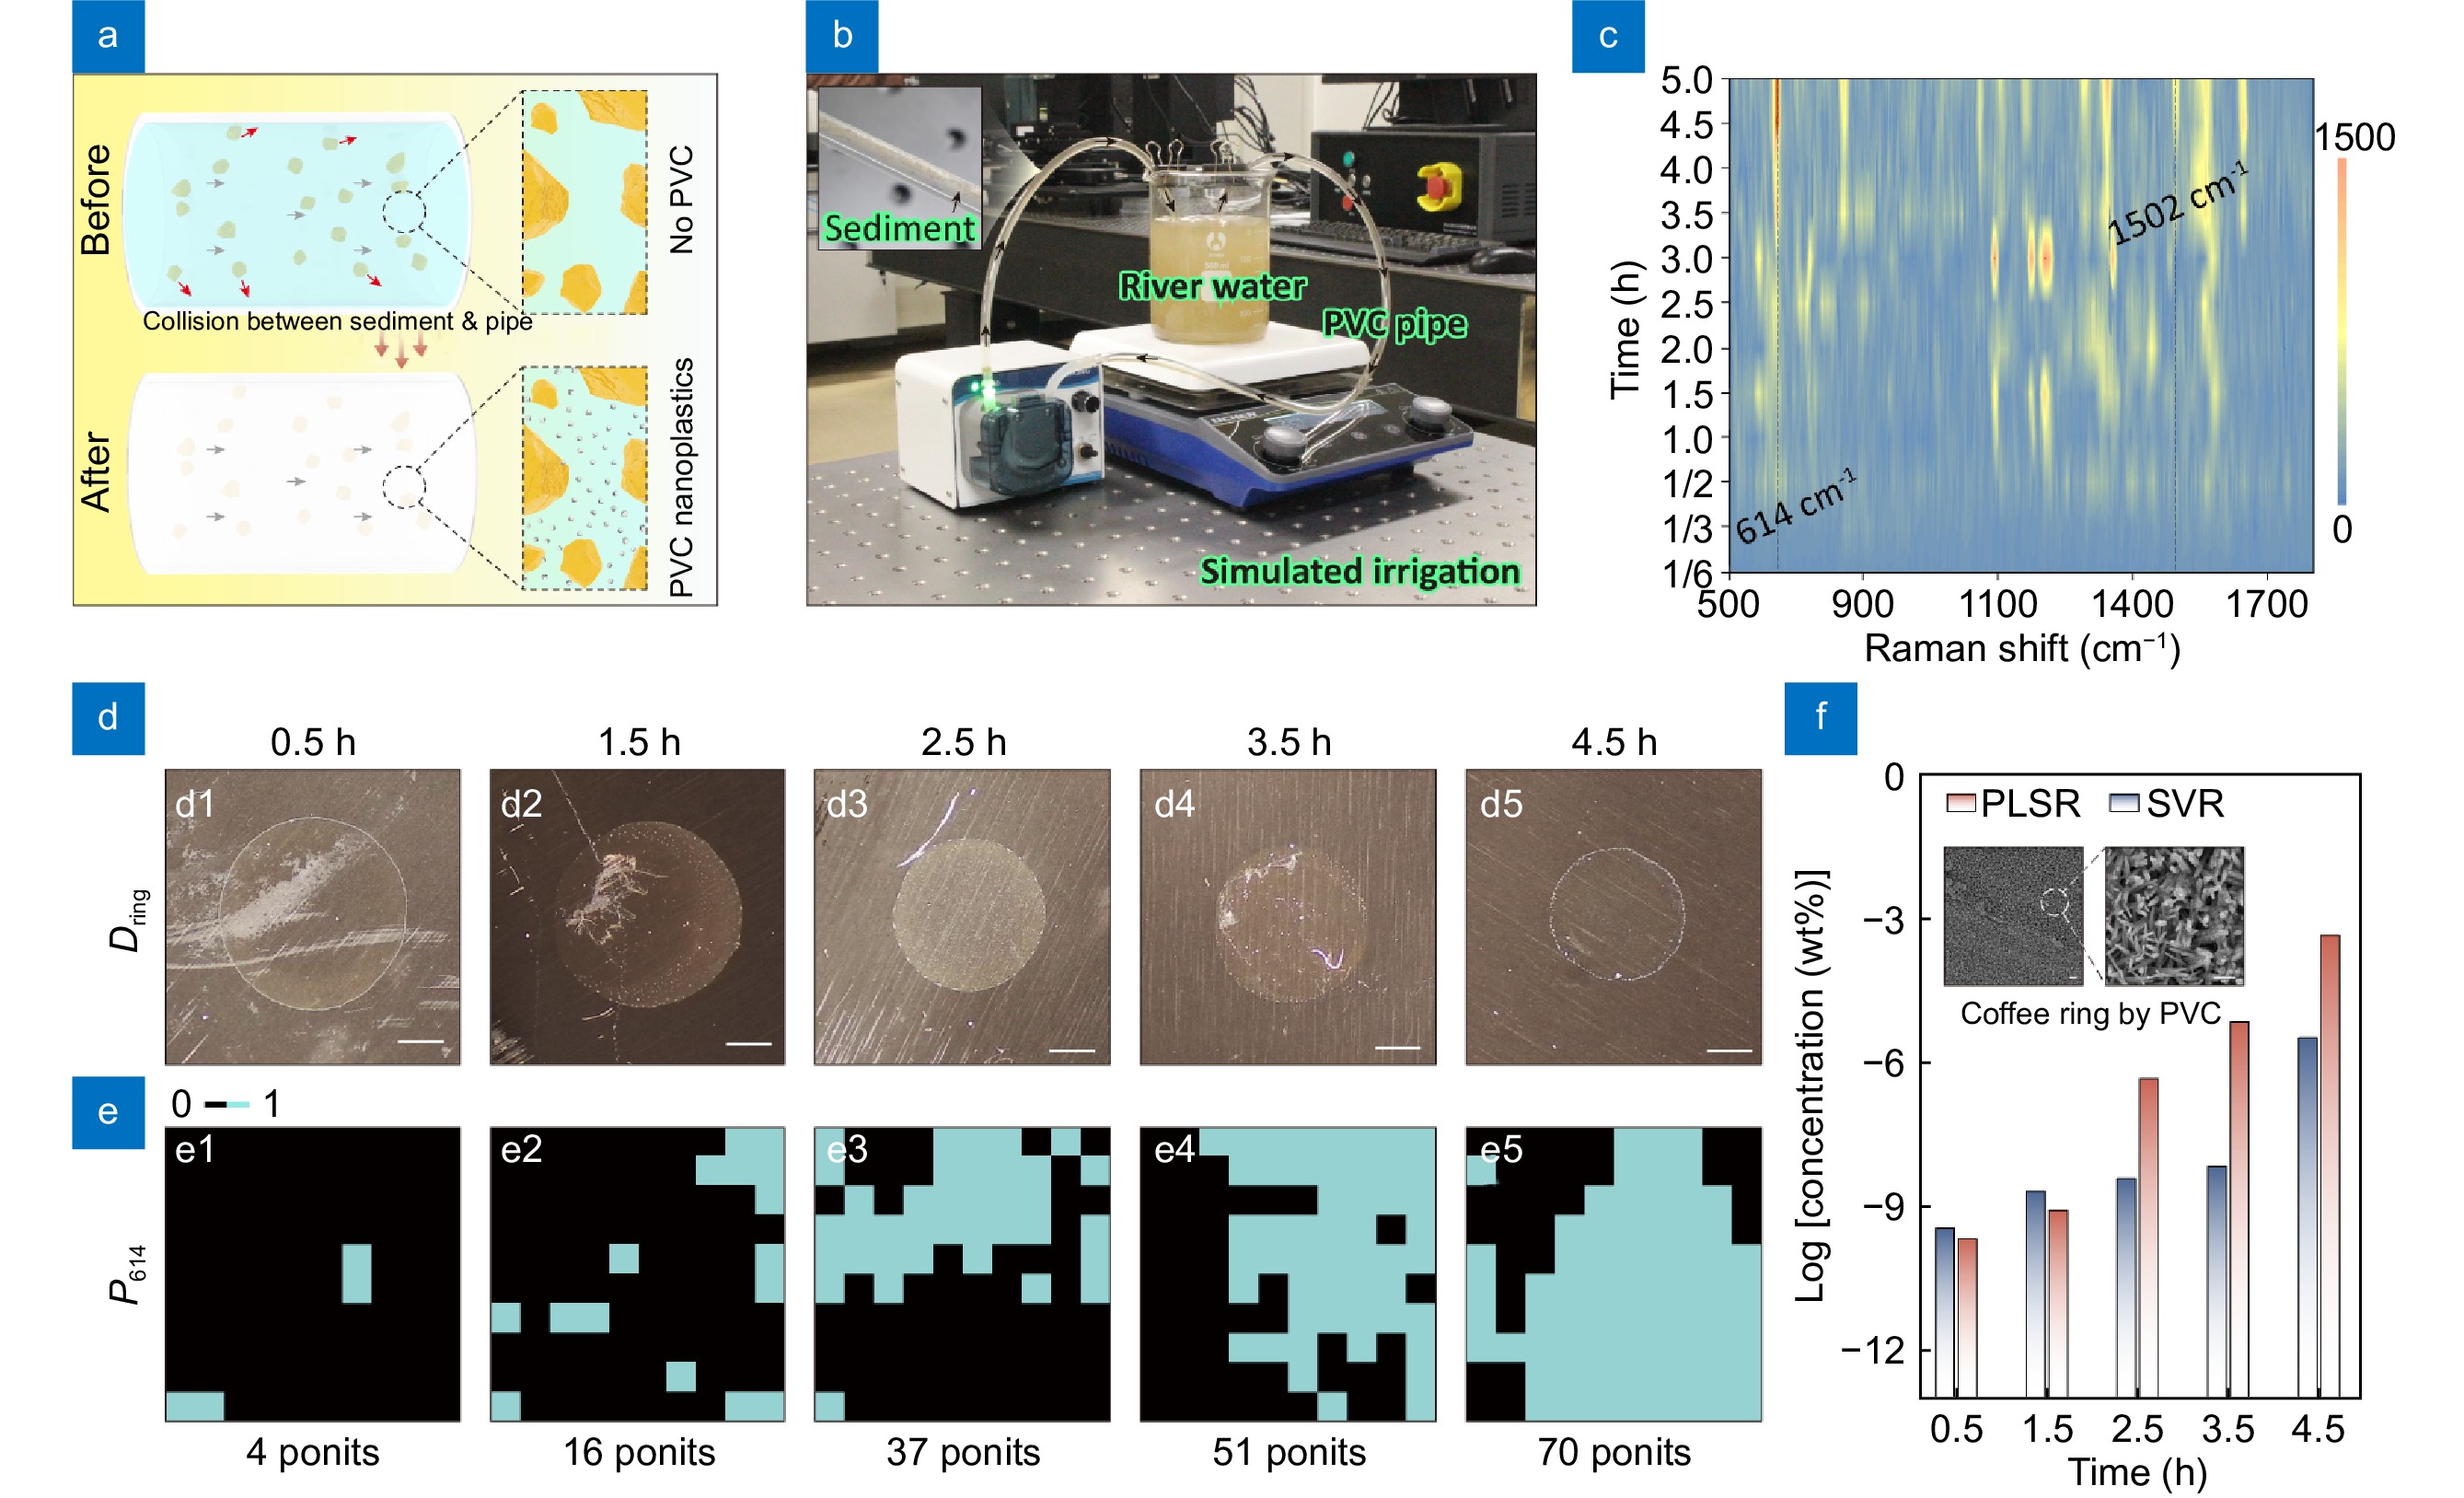
Currently, in many rural areas of China, the irrigation process for crops still involves extracting river or well water, which is then transported to the fields via PVC pipes. During this process, sediment particles in the river or well water collide with the inner walls of the PVC pipes, generating PVC micro/nanoplastics (Fig. 5(a)). These particles are subsequently absorbed by the crops and eventually transferred into the human body through the food chain, posing potential health risks to people45,47,48. In this study, we also simulated this process as illustrated in Fig. 5(b), with the water sampled from a real river in Jinan, Shandong Province, China (the location is marked as Fig. S10) which runs through many villages. After the equipment had been in continuous work for a period of time, we collected liquid samples at different time intervals. The collected liquids were then filtered using a syringe filter device (pore size ≈50 nm), and the filtered liquid was subsequently dropped onto the surface of H-CuO@Ag NWs to form a coffee ring. Figure 5(c) displays the temporal evolution of Raman spectra within the coffee ring. As shown in the figure, PVC component was indeed detected in the solution (614 cm−1 for C–Cl bond and 1502 cm−1 for C=C bond)49−51. Since the solution was filtered using a syringe filter device, the size of the PVC particles is reduced to below 50 nm, which indicates a strong potential for biotoxicity. The Raman spectral intensity in Fig. 5(c) gradually increases over time, indicating a rising concentration of nano-sized PVC in the solution. Figure 5(d) and 5(e) further present the optical images of the coffee rings formed by the PVC nanoplastics at different time points, along with the POD of characteristic peaks 614 cm−1 (P614). As previously discussed, if we select both the Dring and P614 as feature vectors, we can utilize the previously developed machine learning model on PS-50 to predict the concentration of the PVC nanoplastics at corresponding time points. The results, shown in Fig. 5(f), suggest that within 4.5 hours, the concentration of PVC nanoplastics in the solution could exceed 3.26 × 10⁻⁶ wt%. Since the machine learning model used for prediction was not developed based on nano-sized PVC, this measurement is considered semi-quantitative. Nevertheless, this represents the first instance of a rough quantitative analysis of small-sized nano-PVC using SERS technology. It can be confirmed that this method will undoubtedly provide a novel strategy for precise SERS measurements of PVC nanoplastics, as well as a viable approach for SERS measurements of other analytes52−55 .
![Figure 5. (a) Schematic: collision between sediment and PVC pipe during the irrigation process. (b) Home-made cyclic irrigation device. (c) Temporal evolution of Raman spectra within the coffee ring. (d1–d5) Optical images of the coffee rings formed by the PVC nanoplastics at different time points, and the scale bars in them are all 0.5 mm. (e1–e5) P614 in (d1–d5). (f) Predicted concentrations of PVC nanoplastics in (d1–d5) by PLSR and SVR models those trained by PS-50, and the inset shows the SEM images of the coffee ring formed by PVC nanoplastics.]() (a) Schematic: collision between sediment and PVC pipe during the irrigation process. (b) Home-made cyclic irrigation device. (c) Temporal evolution of Raman spectra within the coffee ring. (d1–d5) Optical images of the coffee rings formed by the PVC nanoplastics at different time points, and the scale bars in them are all 0.5 mm. (e1–e5) P614 in (d1–d5). (f) Predicted concentrations of PVC nanoplastics in (d1–d5) by PLSR and SVR models those trained by PS-50, and the inset shows the SEM images of the coffee ring formed by PVC nanoplastics.
(a) Schematic: collision between sediment and PVC pipe during the irrigation process. (b) Home-made cyclic irrigation device. (c) Temporal evolution of Raman spectra within the coffee ring. (d1–d5) Optical images of the coffee rings formed by the PVC nanoplastics at different time points, and the scale bars in them are all 0.5 mm. (e1–e5) P614 in (d1–d5). (f) Predicted concentrations of PVC nanoplastics in (d1–d5) by PLSR and SVR models those trained by PS-50, and the inset shows the SEM images of the coffee ring formed by PVC nanoplastics.Conclusions
In summary, this work addresses the challenge of quantitative SERS detection for trace amounts of small-sized nanoplastics (<100 nm) by designing and fabricating an H-CuO@Ag NWs SERS substrate and proposing a multiplex-feature analysis strategy based on the coffee ring effect. Due to the excellent electromagnetic enhancement property of H-CuO@Ag NWs and the enrichment of the coffee ring on analytes, the substrate exhibits high Raman enhancement capabilities, achieving a LOD as low as 10−10 wt% for PS-50. Additionally, experimental results demonstrate that the diameter of the coffee ring and the POD of Raman signals within the coffee ring are highly correlated with the concentration of the nanoplastic dispersion deposited on the surface. Through statistical analysis, we further incorporated the Raman signal intensity, coffee ring diameter, and POD as combined features. Using machine learning algorithms, we established a mapping relationship between the coffee ring characteristics and nanoplastic concentration, enabling the prediction of nanoplastic dispersion concentrations. Experimental results show that within the concentration range of 1–10−10 wt%, the MSE of this method's predictions is only 0.21–0.54, which represents a 19-fold improvement in prediction accuracy compared to traditional linear regression-based analysis methods. The primary advantage of this detection method is that it combines the high sensitivity and fingerprint characteristics of SERS spectra while overcoming the limitation of Raman signal intensity failing to accurately reflect changes in analyte concentration at low concentrations. Thus, this approach offers strong practical applicability and provides a novel direction for future precise SERS measurements of nanoplastics.
Acknowledgements
We sincerely thank the National Natural Science Foundation of China (No. 12174229 and 22375117), Natural Science Foundation of Shandong Province (No. ZR2022YQ02 and ZR2023MB149) and Taishan Scholars Program of Shandong Province (No. tsqn202306152) for financial support.
Competing interests
The authors declare no competing financial interests.
-
References
[1] Alimi OS, Budarz JF, Hernandez LM et al. Microplastics and nanoplastics in aquatic environments: Aggregation, deposition, and enhanced contaminant transport. Environ Sci Technol 52, 1704–1724 (2018). DOI: 10.1021/acs.est.7b05559[2] MacLeo M, Arp HPH, Tekman MB et al. The global threat from plastic pollution. Science 373, 61–65 (2021). DOI: 10.1126/science.abg5433[3] Geyer R, Jambeck JR, Law KL. Production, use, and fate of all plastics ever made. Sci Adv 3, e1700782 (2017). DOI: 10.1126/sciadv.1700782[4] Zhang JJ, Peng M, Lian EK et al. Identification of poly(ethylene terephthalate) nanoplastics in commercially bottled drinking water using surface-enhanced raman spectroscopy. Environ Sci Technol 57, 8365–8372 (2023). DOI: 10.1021/acs.est.3c00842[5] Jiang Y, Wang XC, Zhao G et al. Silver nanostars arrayed on go/mwcnt composite membranes for enrichment and sers detection of polystyrene nanoplastics in water. Water Res 255, 121444 (2024). DOI: 10.1016/j.watres.2024.121444[6] Moon S, Martin LMA, Kim S et al. Direct observation and identification of nanoplastics in ocean water. Sci Adv 10, eadh1675 (2024). DOI: 10.1126/sciadv.adh1675View full references list -
Author Information
-
Supplementary Information
-
Copyright
Open Access. © The Author(s). This article is licensed under a Creative Commons Attribution 4.0 International License. To view a copy of this license, visit http://creativecommons.org/licenses/by/4.0/. -
About this Article
Cite this Article
Lin XN, Lei FC, Liang X et al. Quantitative detection of trace nanoplastics (down to 50 nm) via surface-enhanced Raman scattering based on the multiplex-feature coffee ring. Opto-Electron Adv 8, 240260 (2025). DOI: 10.29026/oea.2025.240260Download CitationArticle History
- Received Date October 31, 2024
- Accepted Date February 24, 2025
- Available Online March 27, 2025
- Published Date June 18, 2025
Article Metrics
Article Views(637) PDF Downloads(177)
New website getting online, testing
 OE Journals Group

Focuses on the advances of the cutting edge innovations of optics, photonics and optoelectronics
JCR Impact Factor: 22.4
CiteScore: 26.8
Open Access