
 E-mail Alert
 RSS
RSS
| Citation: |
Qi ZY, Guo QC, Wang S, Jia MY, Gao XW et al. All-fiber-transmission photometry for simultaneous optogenetic stimulation and multi-color neuronal activity recording. Opto-Electron Adv 5, 210081 (2022). doi: 10.29026/oea.2022.210081

|
All-fiber-transmission photometry for simultaneous optogenetic stimulation and multi-color neuronal activity recording
-
Abstract
Manipulating and real-time monitoring of neuronal activities with cell-type specificity and precise spatiotemporal resolution during animal behavior are fundamental technologies for exploring the functional connectivity, information transmission, and physiological functions of neural circuitsin vivo. However, current techniques for optogenetic stimulation and neuronal activity recording mostly operate independently. Here, we report an all-fiber-transmission photometry system for simultaneous optogenetic manipulation and multi-color recording of neuronal activities and the neurotransmitter release in a freely moving animal. We have designed and manufactured a wavelength-independent multi-branch fiber bundle to enable simultaneous optogenetic manipulation and multi-color recording at different wavelengths. Further, we combine a laser of narrow linewidth with the lock-in amplification method to suppress the optogenetic stimulation-induced artifacts and channel crosstalk. We show that the collection efficiency of our system outperforms a traditional epi-fluorescence system. Further, we demonstrate successful recording of dynamic dopamine (DA) responses to unexpected rewards in the nucleus accumbens (NAc) in a freely moving mouse. We also show simultaneous dual-color recording of neuronal Ca2+ signals and DA dynamics in the NAc upon delivering an unexpected reward and the simultaneous optogenetic activating at dopaminergic terminals in the same location. Thus, our multi-function fiber photometry system provides a compatible, efficient, and flexible solution for neuroscientists to study neural circuits and neurological diseases.-
Keywords:
- fiber photometry /
- all-fiber-transmission /
- multi-color /
- optogenetic /
- neuroscience
-

-
References
[1] Boyden ES, Zhang F, Bamberg E, Nagel G, Deisseroth K. Millisecond-timescale, genetically targeted optical control of neural activity. Nat Neurosci 8, 1263–1268 (2005). doi: 10.1038/nn1525 [2] Grienberger C, Konnerth A. Imaging calcium in neurons. Neuron 73, 862–885 (2012). doi: 10.1016/j.neuron.2012.02.011 [3] Li Y, Zhong WX, Wang DQ, Feng QR, Liu ZX et al. Serotonin neurons in the dorsal raphe nucleus encode reward signals. Nat Commun 7, 10503 (2016). doi: 10.1038/ncomms10503 [4] Grosenick L, Marshel JH, Deisseroth K. Closed-loop and activity-guided optogenetic control. Neuron 86, 106–139 (2015). doi: 10.1016/j.neuron.2015.03.034 [5] Harris JA, Mihalas S, Hirokawa KE, Whitesell JD, Choi H et al. Hierarchical organization of cortical and thalamic connectivity. Nature 575, 195–202 (2019). doi: 10.1038/s41586-019-1716-z [6] Chaudhury D, Walsh JJ, Friedman AK, Juarez B, Ku SM et al. Rapid regulation of depression-related behaviours by control of midbrain dopamine neurons. Nature 493, 532–536 (2013). doi: 10.1038/nature11713 [7] Wang L, Chen IZ, Lin DY. Collateral pathways from the ventromedial hypothalamus mediate defensive behaviors. Neuron 85, 1344–1358 (2015). doi: 10.1016/j.neuron.2014.12.025 [8] Tsai HC, Zhang F, Adamantidis A, Stuber GD, Bonci A et al. Phasic firing in dopaminergic neurons is sufficient for behavioral conditioning. Science 324, 1080–1084 (2009). doi: 10.1126/science.1168878 [9] Floresco SB, West AR, Ash B, Moore H, Grace AA. Afferent modulation of dopamine neuron firing differentially regulates tonic and phasic dopamine transmission. Nat Neurosci 6, 968–973 (2003). doi: 10.1038/nn1103 [10] Krook-Magnuson E, Armstrong C, Bui A, Lew S, Oijala M et al. In vivo evaluation of the dentate gate theory in epilepsy. J Physiol 593, 2379–2388 (2015). doi: 10.1113/JP270056 [11] Adelsberger H, Grienberger C, Stroh A, Konnerth A. In vivo calcium recordings and channelrhodopsin-2 activation through an optical fiber. Cold Spring Harb Protoc 2014, pdb.prot084145 (2014). doi: 10.1101/pdb.prot084145 [12] Liu ZX, Zhou JF, Li Y, Hu F, Lu Y et al. Dorsal raphe neurons signal reward through 5-HT and glutamate. Neuron 81, 1360–1374 (2014). doi: 10.1016/j.neuron.2014.02.010 [13] Zhao HX, Li K, Yang F, Zhou WH, Chen NB et al. Customized anterior segment photoacoustic imaging for ophthalmic burn evaluation in vivo. Opto-Electron Adv 4, 200017 (2021). doi: 10.29026/oea.2021.200017 [14] Adelsberger H, Garaschuk O, Konnerth A. Cortical calcium waves in resting newborn mice. Nat Neurosci 8, 988–990 (2005). doi: 10.1038/nn1502 [15] Guo QC, Zhou JF, Feng QR, Lin R, Gong H et al. Multi-channel fiber photometry for population neuronal activity recording. Biomed Opt Express 6, 3919–3931 (2015). doi: 10.1364/BOE.6.003919 [16] Stosiek C, Garaschuk O, Holthoff K, Konnerth A. In vivo two-photon calcium imaging of neuronal networks. Proc Natl Acad Sci USA 100, 7319–7324 (2003). doi: 10.1073/pnas.1232232100 [17] Zong WJ, Wu RL, Li ML, Hu YH, Li YJ et al. Fast high-resolution miniature two-photon microscopy for brain imaging in freely behaving mice. Nat Methods 14, 713–719 (2017). doi: 10.1038/nmeth.4305 [18] Ghosh KK, Burns LD, Cocker ED, Nimmerjahn A, Ziv Y et al. Miniaturized integration of a fluorescence microscope. Nat Methods 8, 871–878 (2011). doi: 10.1038/nmeth.1694 [19] Cui GH, Jun SB, Jin X, Pham MD, Vogel SS et al. Concurrent activation of striatal direct and indirect pathways during action initiation. Nature 494, 238–242 (2013). doi: 10.1038/nature11846 [20] Cui GH, Jun SB, Jin X, Luo GX, Pham MD et al. Deep brain optical measurements of cell type-specific neural activity in behaving mice. Nat Protoc 9, 1213–1228 (2014). doi: 10.1038/nprot.2014.080 [21] Li L, Tang YJ, Sun LQ, Rahman K, Huang K et al. In vivo fiber photometry of neural activity in response to optogenetically manipulated inputs in freely moving mice. J Innovative Opt Health Sci 10, 1743001 (2017). doi: 10.1142/S1793545817430015 [22] Guo J, Ran MZ, Gao ZL, Zhang XX, Wang D et al. Cell-type-specific imaging of neurotransmission reveals a disrupted excitatory-inhibitory cortical network in isoflurane anaesthesia. eBioMedicine 65, 103272 (2021). doi: 10.1016/j.ebiom.2021.103272 [23] Guan BO, Jin L, Ma J, Liang YZ, Bai X. Flexible fiber-laser ultrasound sensor for multiscale photoacoustic imaging. Opto-Electron Adv 4, 200081 (2021). doi: 10.29026/oea.2021.200081 [24] Anikeeva P, Andalman AS, Witten I, Warden M, Goshen I et al. Optetrode: a multichannel readout for optogenetic control in freely moving mice. Nat Neurosci 15, 163–170 (2012). doi: 10.1038/nn.2992 [25] Stroh A, Adelsberger H, Groh A, Rühlmann C, Fischer S et al. Making waves: initiation and propagation of corticothalamic Ca2+ waves in vivo. Neuron 77, 1136–1150 (2013). doi: 10.1016/j.neuron.2013.01.031 [26] Kim CK, Yang SJ, Pichamoorthy N, Young NP, Kauvar I et al. Simultaneous fast measurement of circuit dynamics at multiple sites across the mammalian brain. Nat Methods 13, 325–328 (2016). doi: 10.1038/nmeth.3770 [27] Stamatakis AM, Schachter MJ, Gulati S, Zitelli KT, Malanowski S et al. Simultaneous optogenetics and cellular resolution calcium imaging during active behavior using a miniaturized microscope. Front Neurosci 12, 496 (2018). doi: 10.3389/fnins.2018.00496 [28] Yang WJ, Carrillo-Reid L, Bando Y, Peterka DS, Yuste R. Simultaneous two-photon imaging and two-photon optogenetics of cortical circuits in three dimensions. eLife 7, e32671 (2018). doi: 10.7554/eLife.32671 [29] Falkner AL, Grosenick L, Davidson TJ, Deisseroth K, Lin DY. Hypothalamic control of male aggression-seeking behavior. Nat Neurosci 19, 596–604 (2016). doi: 10.1038/nn.4264 [30] Wan YQ, Wang MQ, Zhang SR, Xie BB. Availability and safety assessment of infrared neural stimulation at high repetition rate through an implantable optrode. J Innovative Opt Health Sci 14, 2150014 (2021). doi: 10.1142/S1793545821500140 [31] Chen TW, Wardill TJ, Sun Y, Pulver SR, Renninger SL et al. Ultrasensitive fluorescent proteins for imaging neuronal activity. Nature 499, 295–300 (2013). doi: 10.1038/nature12354 [32] Dana H, Mohar B, Sun Y, Narayan S, Gordus A et al. Sensitive red protein calcium indicators for imaging neural activity. eLife 5, e12727 (2016). doi: 10.7554/eLife.12727 [33] Sun FM, Zeng JZ, Jing M, Zhou JH, Feng JS et al. A genetically encoded fluorescent sensor enables rapid and specific detection of dopamine in flies, fish, and mice. Cell 174, 481–496.e19 (2018). doi: 10.1016/j.cell.2018.06.042 [34] Patriarchi T, Mohebi A, Sun JQ, Marley A, Liang RQ et al. An expanded palette of dopamine sensors for multiplex imaging in vivo. Nat Methods 17, 1147–1155 (2020). doi: 10.1038/s41592-020-0936-3 [35] Luo F, Wei Y, Wang ZY, Luo MM, Hu J. Genetically encoded neural activity indicators. Brain Sci Adv 4, 1–15 (2018). doi: 10.26599/BSA.2018.9050007 [36] Helmchen F, Denk W. Deep tissue two-photon microscopy. Nat Methods 2, 932–940 (2005). doi: 10.1038/nmeth818 [37] Barretto RPJ, Messerschmidt B, Schnitzer MJ. In vivo fluorescence imaging with high-resolution microlenses. Nat Methods 6, 511–512 (2009). doi: 10.1038/nmeth.1339 [38] Bocarsly ME, Jiang WC, Wang C, Dudman JT, Ji N et al. Minimally invasive microendoscopy system for in vivo functional imaging of deep nuclei in the mouse brain. Biomed Opt Express 6, 4546–4556 (2015). doi: 10.1364/BOE.6.004546 [39] Resendez SL, Jennings JH, Ung RL, Namboodiri VMK, Zhou ZC et al. Visualization of cortical, subcortical and deep brain neural circuit dynamics during naturalistic mammalian behavior with head-mounted microscopes and chronically implanted lenses. Nat Protoc 11, 566–597 (2016). doi: 10.1038/nprot.2016.021 [40] Qin H, Lu J, Jin WJ, Chen XW, Fu L. Multichannel fiber photometry for mapping axonal terminal activity in a restricted brain region in freely moving mice. Neurophotonics 6, 035011 (2019). doi: 10.1117/1.NPh.6.3.035011 [41] Sych Y, Chernysheva M, Sumanovski LT, Helmchen F. High-density multi-fiber photometry for studying large-scale brain circuit dynamics. Nat Methods 16, 553–560 (2019). doi: 10.1038/s41592-019-0400-4 [42] Pisano F, Pisanello M, Lee SJ, Lee J, Maglie E et al. Depth-resolved fiber photometry with a single tapered optical fiber implant. Nat Methods 16, 1185–1192 (2019). doi: 10.1038/s41592-019-0581-x [43] Klapoetke NC, Murata Y, Kim SS, Pulver SR, Birdsey-Benson A et al. Independent optical excitation of distinct neural populations. Nat Methods 11, 338–346 (2014). doi: 10.1038/nmeth.2836 [44] Coda S, Thompson AJ, Kennedy GT, Roche KL, Ayaru L et al. Fluorescence lifetime spectroscopy of tissue autofluorescence in normal and diseased colon measured ex vivo using a fiber-optic probe. Biomed Opt Express 5, 515–538 (2014). doi: 10.1364/BOE.5.000515 [45] Zhang L, Pan J, Zhang Z, Wu H, Yao N et al. Ultrasensitive skin-like wearable optical sensors based on glass micro/nanofibers. Opto-Electron Adv 3, 190022 (2020). doi: 10.29026/oea.2020.190022 [46] Tan FZ, Lyu W, Chen SY, Liu ZY, Yu CY. Contactless vital signs monitoring based on few-mode and multi-core fibers. Opto-Electron Adv 3, 190034 (2020). doi: 10.29026/oea.2020.190034 [47] Simone K, Füzesi T, Rosenegger D, Bains J, Murari K. Open-source, cost-effective system for low-light in vivo fiber photometry. Neurophotonics 5, 025006 (2018). doi: 10.1117/1.NPh.5.2.025006 [48] Gunaydin LA, Grosenick L, Finkelstein JC, Kauvar IV, Fenno LE et al. Natural neural projection dynamics underlying social behavior. Cell 157, 1535–1551 (2014). doi: 10.1016/j.cell.2014.05.017 [49] Lerner TN, Shilyansky C, Davidson TJ, Evans KE, Beier KT et al. Intact-brain analyses reveal distinct information carried by SNc dopamine subcircuits. Cell 162, 635–647 (2015). doi: 10.1016/j.cell.2015.07.014 [50] Owen SF, Kreitzer AC. An open-source control system for in vivo fluorescence measurements from deep-brain structures. J Neurosci Methods 311, 170–177 (2019). doi: 10.1016/j.jneumeth.2018.10.022 [51] Bromberg-Martin ES, Matsumoto M, Hikosaka O. Dopamine in motivational control: rewarding, aversive, and alerting. Neuron 68, 815–834 (2010). doi: 10.1016/j.neuron.2010.11.022 [52] Björklund A, Dunnett SB. Dopamine neuron systems in the brain: an update. Trends Neurosci 30, 194–202 (2007). doi: 10.1016/j.tins.2007.03.006 [53] Yuan L, Dou YN, Sun YG. Topography of reward and aversion encoding in the mesolimbic dopaminergic system. J Neurosci 39, 6472–6481 (2019). doi: 10.1523/JNEUROSCI.0271-19.2019 [54] Peng WL, Wu ZF, Song K, Zhang SY, Li YL et al. Regulation of sleep homeostasis mediator adenosine by basal forebrain glutamatergic neurons. Science 369, eabb0556 (2020). doi: 10.1126/science.abb0556 [55] Nieh EH, Vander Weele CM, Matthews GA, Presbrey KN, Wichmann R et al. Inhibitory input from the lateral hypothalamus to the ventral tegmental area disinhibits dopamine neurons and promotes behavioral activation. Neuron 90, 1286–1298 (2016). doi: 10.1016/j.neuron.2016.04.035 [56] Schultz W. Dopamine reward prediction-error signalling: a two-component response. Nat Rev Neurosci 17, 183–195 (2016). doi: 10.1038/nrn.2015.26 [57] Covey DP, Cheer JF. Accumbal dopamine release tracks the expectation of dopamine neuron-mediated reinforcement. Cell Rep 27, 481–490.e3 (2019). doi: 10.1016/j.celrep.2019.03.055 [58] Dreyer JK, Herrik KF, Berg RW, Hounsgaard JD. Influence of phasic and tonic dopamine release on receptor activation. J Neurosci 30, 14273–14283 (2010). doi: 10.1523/JNEUROSCI.1894-10.2010 [59] Kim CK, Sanchez MI, Hoerbelt P, Fenno LE, Malenka RC et al. A molecular calcium integrator reveals a striatal cell type driving aversion. Cell 183, 2003–2019.e16 (2020). doi: 10.1016/j.cell.2020.11.015 [60] Yao SQ, Yuan P, Ouellette B, Zhou T, Mortrud M et al. RecV recombinase system for in vivo targeted optogenomic modifications of single cells or cell populations. Nat Methods 17, 422–429 (2020). doi: 10.1038/s41592-020-0774-3 [61] Lin JY, Knutsen PM, Muller A, Kleinfeld D, Tsien RY. ReaChR: a red-shifted variant of channelrhodopsin enables deep transcranial optogenetic excitation. Nat Neurosci 16, 1499–1508 (2013). doi: 10.1038/nn.3502 -
Supplementary Information
Supplementary Information for All-fiber-transmission photometry for simultaneous optogenetic stimulation and multi-color neuronal activity recording 
-
Access History

Figures(6)
Article Metrics
Export File
Citation
Qi ZY, Guo QC, Wang S, Jia MY, Gao XW et al. All-fiber-transmission photometry for simultaneous optogenetic stimulation and multi-color neuronal activity recording. Opto-Electron Adv 5, 210081 (2022). doi: 10.29026/oea.2022.210081
Format
Content
 DownLoad:


-
Figure 1.
A custom-designed bifurcated fiber bundle and all-fiber-transmission single-channel fiber photometry system. (a) An image of the bifurcated fiber bundle. The bifurcated fiber bundle consists of 3 branches in total: the single-fiber branch i, the collection branch ii, and the common branch iii. The total length of this bundle is about 350 mm. The sub-image of iii was acquired using a high-intensity excitation light coupled into the single-fiber branch i. Scale bar, 200 μm. (b) Diagram of the bifurcated fiber bundle common branch iii. The common branch iii (500 μm) consists of 83 hexagon distributed optical fibers (Φ50 μm/0.54 NA) in total. The single fiber from branch i for excitation light (blue) transmission is placed in the center of branch iii and is surrounded by the other 82 fibers (branch ii) for collecting fluorescence signals. (c) Schematic diagram of the all-fiber-transmission single-channel fiber photometry system constructed with a custom-designed bifurcated fiber bundle. The excitation light from an LED is coupled into the multi-mode fiber connected to the animal through the single-fiber branch i. The emission fluorescence is then collected by the common branch iii and delivered to the PMT (behind a collimator and a fluorescence filter). Abbreviations: PMT, photo multiplier tube; MMF, multi-mode fiber. LED, light emitting diode.
-
Figure 2.
A custom-designed four-branch fiber bundle and multi-function fiber photometry system. (a) An image of the four-branch fiber bundle. The fiber bundle consists of 5 branches in total: the single-fiber branch i–iii, the collection branch iv, and the common branch v. The total length of this bundle is about 350 mm. The sub-image represents the end face of the single-fiber branch i–iii, the collection branch iv, and common branch v with high-intensity excitation light coupled into the three single-fiber branches i–iii. Scale bar, 200 μm. (b) Diagram of the four-branch fiber bundle common branch v. The common branch v (500 μm) consists of 85 hexagon distributed optical fibers (Φ50 μm/0.54 NA) in total. The three brighter fibers in the center of the bundle correspond to the three single-fiber branches i–iii for coupling to three different excitation lights. (c) Schematic diagram of the multi-function fiber photometry system constructed with the four-branch fiber bundle. Three light sources with different wavelengths are coupled into the multi-mode fiber and are connected to the mouse through the three single-fiber branches i–iii. The emission fluorescence is then collected by the common branch v and delivered to the PMT (behind the collimator and the fluorescence filters). The output signals of the PMT are preprocessed by a custom-designed lock-in amplifier, digitized using a DAQ card, and recorded using a custom LabVIEW script (50 Hz per channel). (d) Schematic diagram of the lock-in amplifier for the multi-function fiber photometry system. These two excitation lights are modulated by sinusoidal signals with different frequencies (450 nm, 211 Hz; 561 nm, 531 Hz). The fluorescent signals can thus be de-modulated from the output signals of the PMT by the LIA, using the corresponding demodulation signals; note that crosstalk does not occur between the green and red channels. The stimulation artifacts caused by the optogenetic light (0~50 Hz) can be further inhibited. Abbreviations: PMT, Photo Multiplier Tube; MMF, Multi-Mode Fiber. LIA, Lock-in amplifier.
-
Figure 3.
Evaluation of the light transmission performance of the all-fiber-transmission photometry system. (a, b) The fitting curve of the fluorescence intensity variation of a traditional epi-fluorescence system with the all-fiber-transmission photometry system based on the bifurcated fiber bundle (a) or the four-branch fiber bundle (b). The dashed line represents the curve for y = x. The red line represents the fitting curve for the single-channel fiber photometry system (f(x) = 1.297x, R-square: 0.9938) and the multi-function fiber photometry system (f(x) = 1.233x, R-square: 0.9982). (c) The mean fluorescence intensity of the green (450 on: 0.1254 ± 0.0003; both on: 0.1257 ± 0.0004) and red (561 on: 0.3421 ± 0.0069; both on: 0.3456 ± 0.0059) channel between the other excitation light “off” and “on”. P>0.05, Wilcoxon’s signed-rank test; n = 7 pairs. (d) No significant stimulation artifacts are detected in the green and red channels of the all-fiber-transmission photometry system when applying a 660-nm laser stimulation (P>0.05, Wilcoxon’s signed-rank test; n = 10 pairs). The blue bar indicates the time of stimulation.
-
Figure 4.
Real-time recording of DA dynamics in the NAcC of a freely moving mouse. (a) Schematic diagram of the setup for real-time recording of DA dynamics responses to intra-oral 5% sucrose solution delivery through a cheek fistula3. The sucrose solution was randomly infused for 20 trials in one behavioral session. (b) Histology confirming GRABDA2m expression (green) in the NAcC brain region. GRABDA2m: Ex 450 nm, Em 525 nm. The brain slice is 0.98 mm anterior to the bregma. Scale bar 500 μm. (c) Representative trace of DA signals (encompassing five sequential trials) during the sucrose delivery experiment. The onset times of 5% sucrose solution delivery are indicated above the trace with blue bars. (d) Heatmap of DA signal transients aligned to the onset time of sucrose solution delivery. Each row in the heatmap indicates the data for one behavioral trial; 20 trials are plotted. (e) Averaged DA signal transients in response to sucrose solution delivery. The shaded area represents ±SEM. The blue bar represents a 1 s sucrose delivery event. Orange segments indicate a statistically significant increase from the baseline (*P<0.05, Wilcoxon’s signed-rank test; n = 10 pairs, one mouse). Abbreviations: DA, dopamine; NAc, nucleus accumbens; NAcC, nucleus accumbens core; NAcLat, nucleus accumbens lateral shell; NAcMed, nucleus accumbens medial shell.
-
Figure 5.
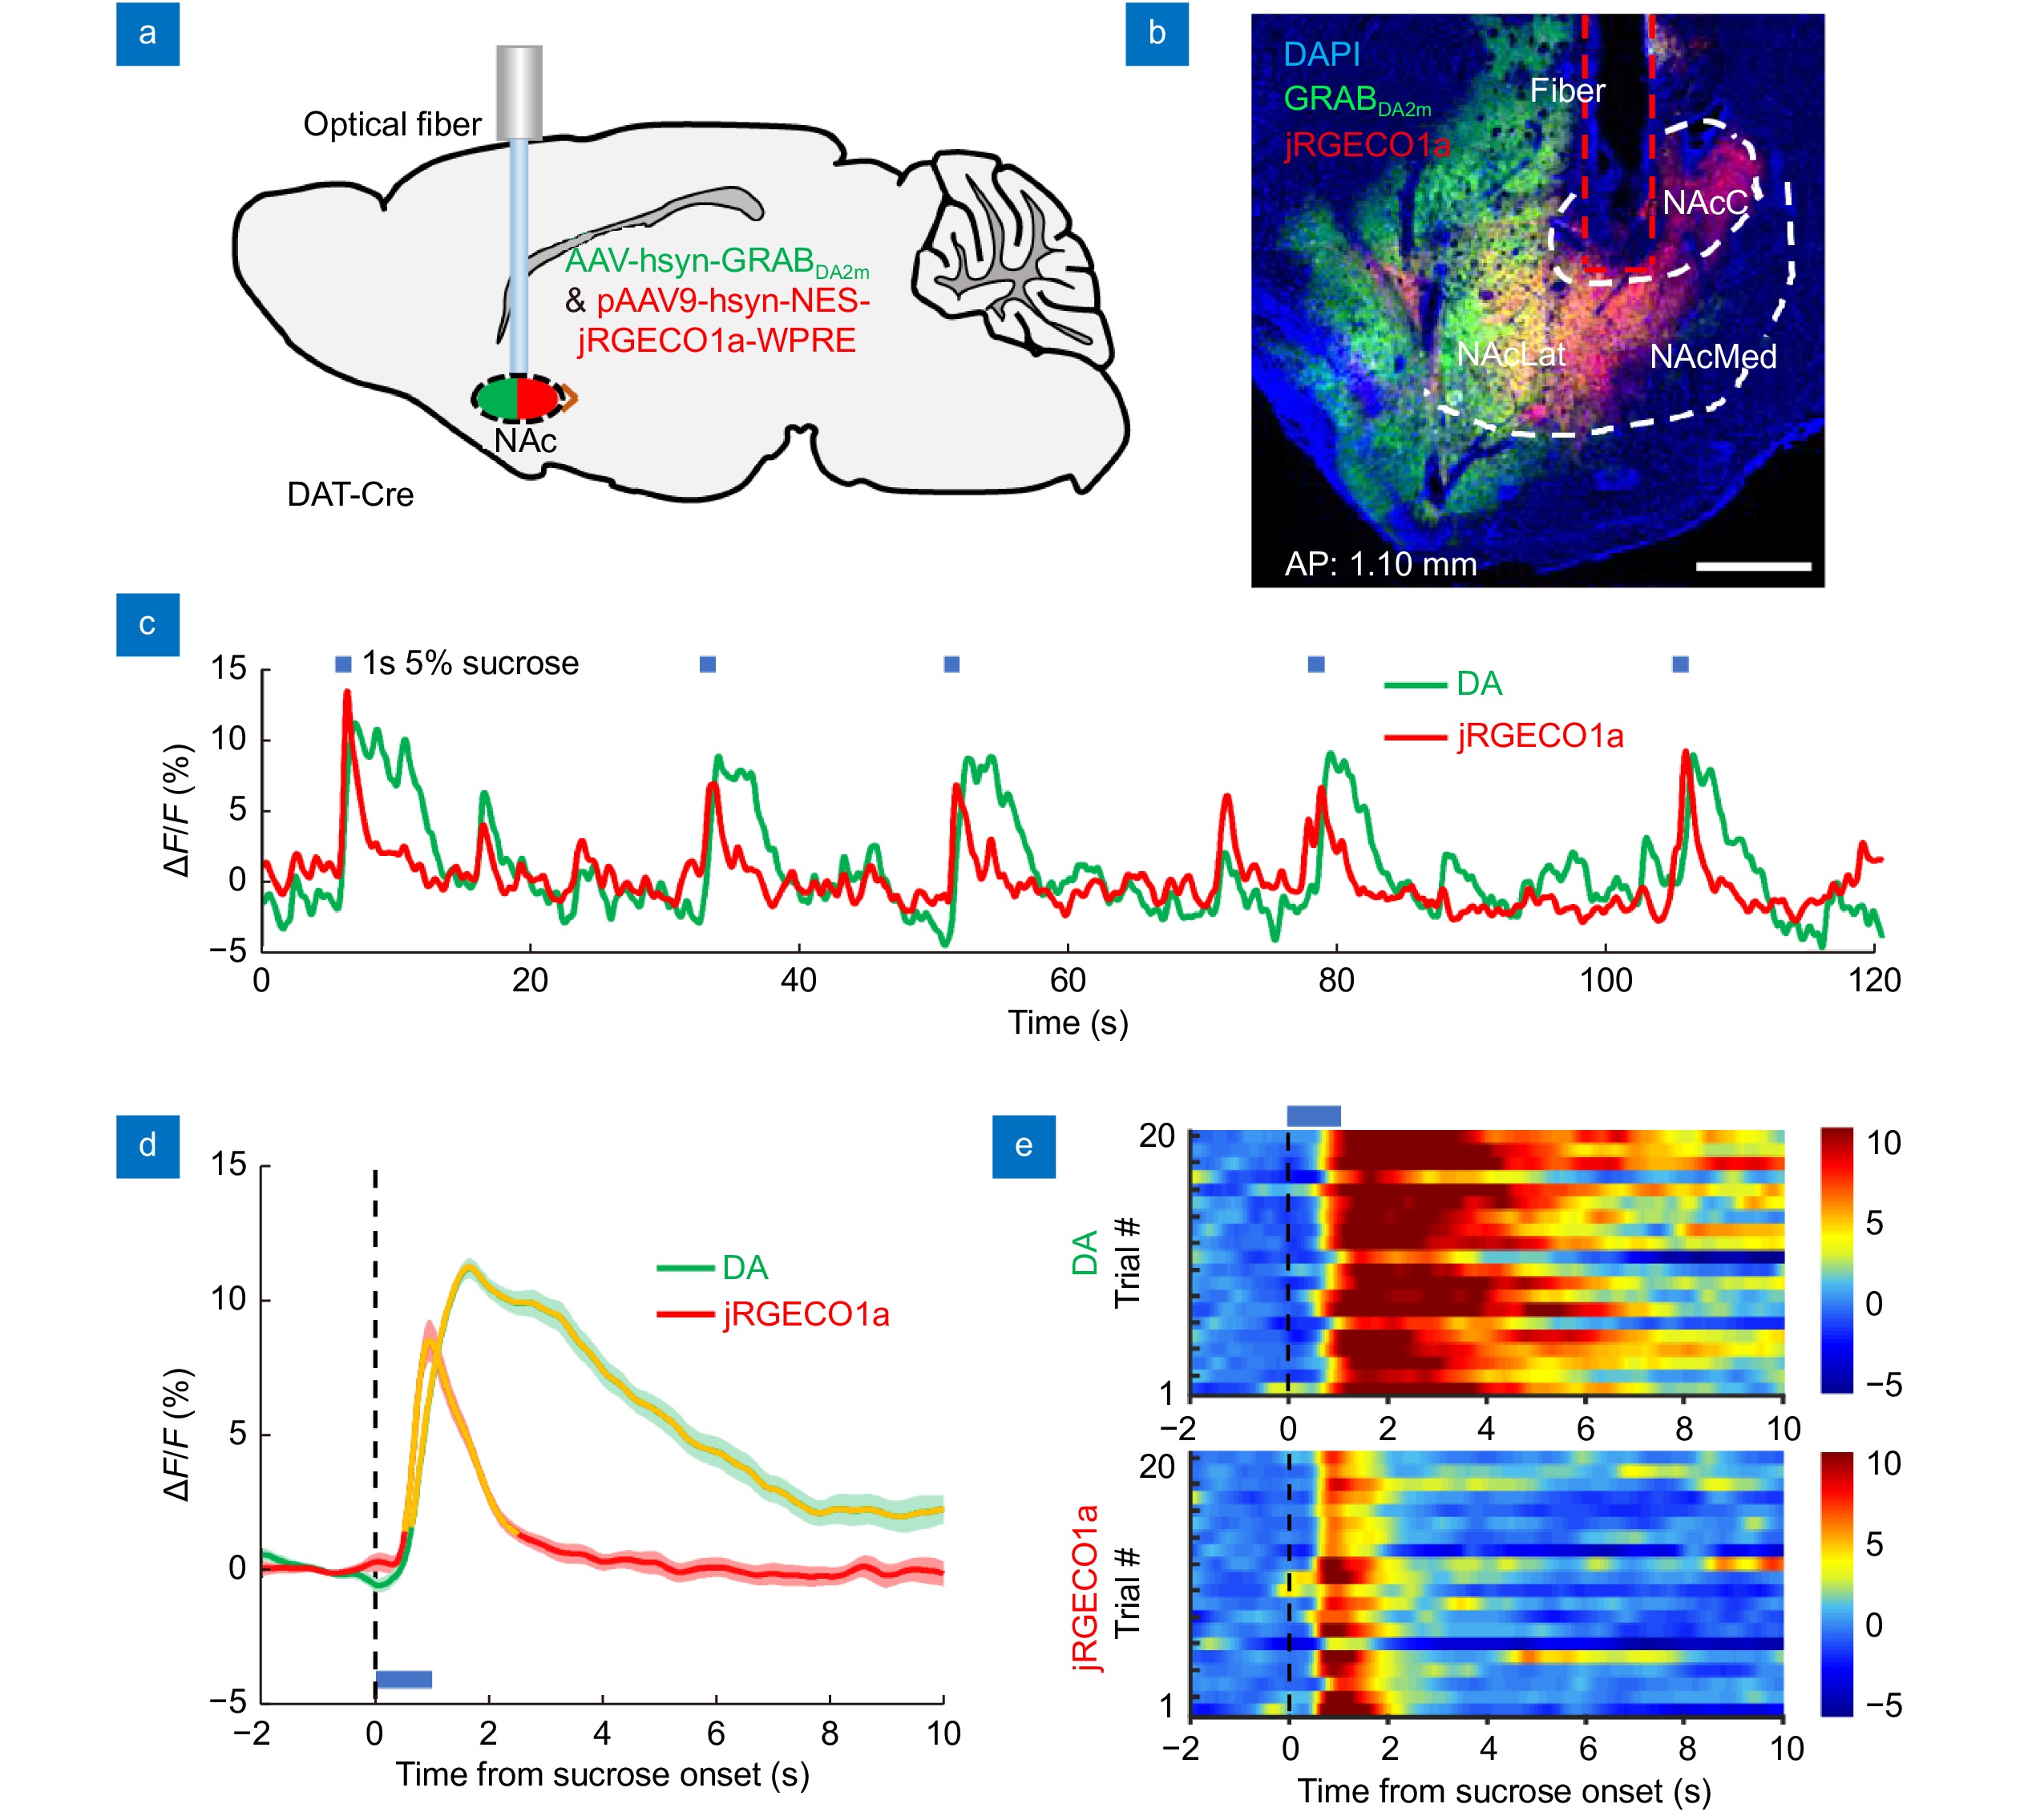
Simultaneous recording of dopamine dynamics and neuronal Ca2+ signals in the NAcLat of a freely moving mouse. (a) Schematic diagram of dual-color recording surgery: we simultaneously record the DA signals (GRABDA2m, green) and the neuronal activity (jGRECO1a, red) in response to a 1 s unexpected sucrose solution in the NAcLat of a freely moving mouse. (b) Histology confirming GRABDA2m (green) and jRGECO1a (red) co-expression in the NAcLat (GRABDA2m: Ex 450 nm, Em 525 nm; jGRECO1a: Ex 561 nm, Em 590 nm). The brain slice is 1.1 mm anterior to the bregma. Scale bar, 500 μm. (c) Representative trace of DA signals and neuronal Ca2+ signals simultaneously acquired (encompassing five sequential trials) during the sucrose delivery experiment. The onset times of 5% sucrose solution delivery are indicated above the trace with blue bars. (d) Averaged DA signal and neuronal Ca2+ signal transients in response to unexpected sucrose solution. The shaded area represents the SEM (±). The blue bar represents the 1 s sucrose solution. Orange segments indicate a statistically significant increase from the baseline (*P<0.05, Wilcoxon’s signed-rank test; n = 20 pairs, one mouse). (e) Heatmap of DA signal and neuronal Ca2+ signal transients, aligned to the onset time of sucrose solution delivery. Each row in the heatmap indicates the data for one behavioral trial; 20 trials are plotted. The blue bar represents the delivery of a 1 s sucrose solution. Abbreviations: DA, dopamine; NAc, nucleus accumbens; NAcC, nucleus accumbens core; NAcLat, nucleus accumbens lateral shell; NAcMed, nucleus accumbens medial shell.
-
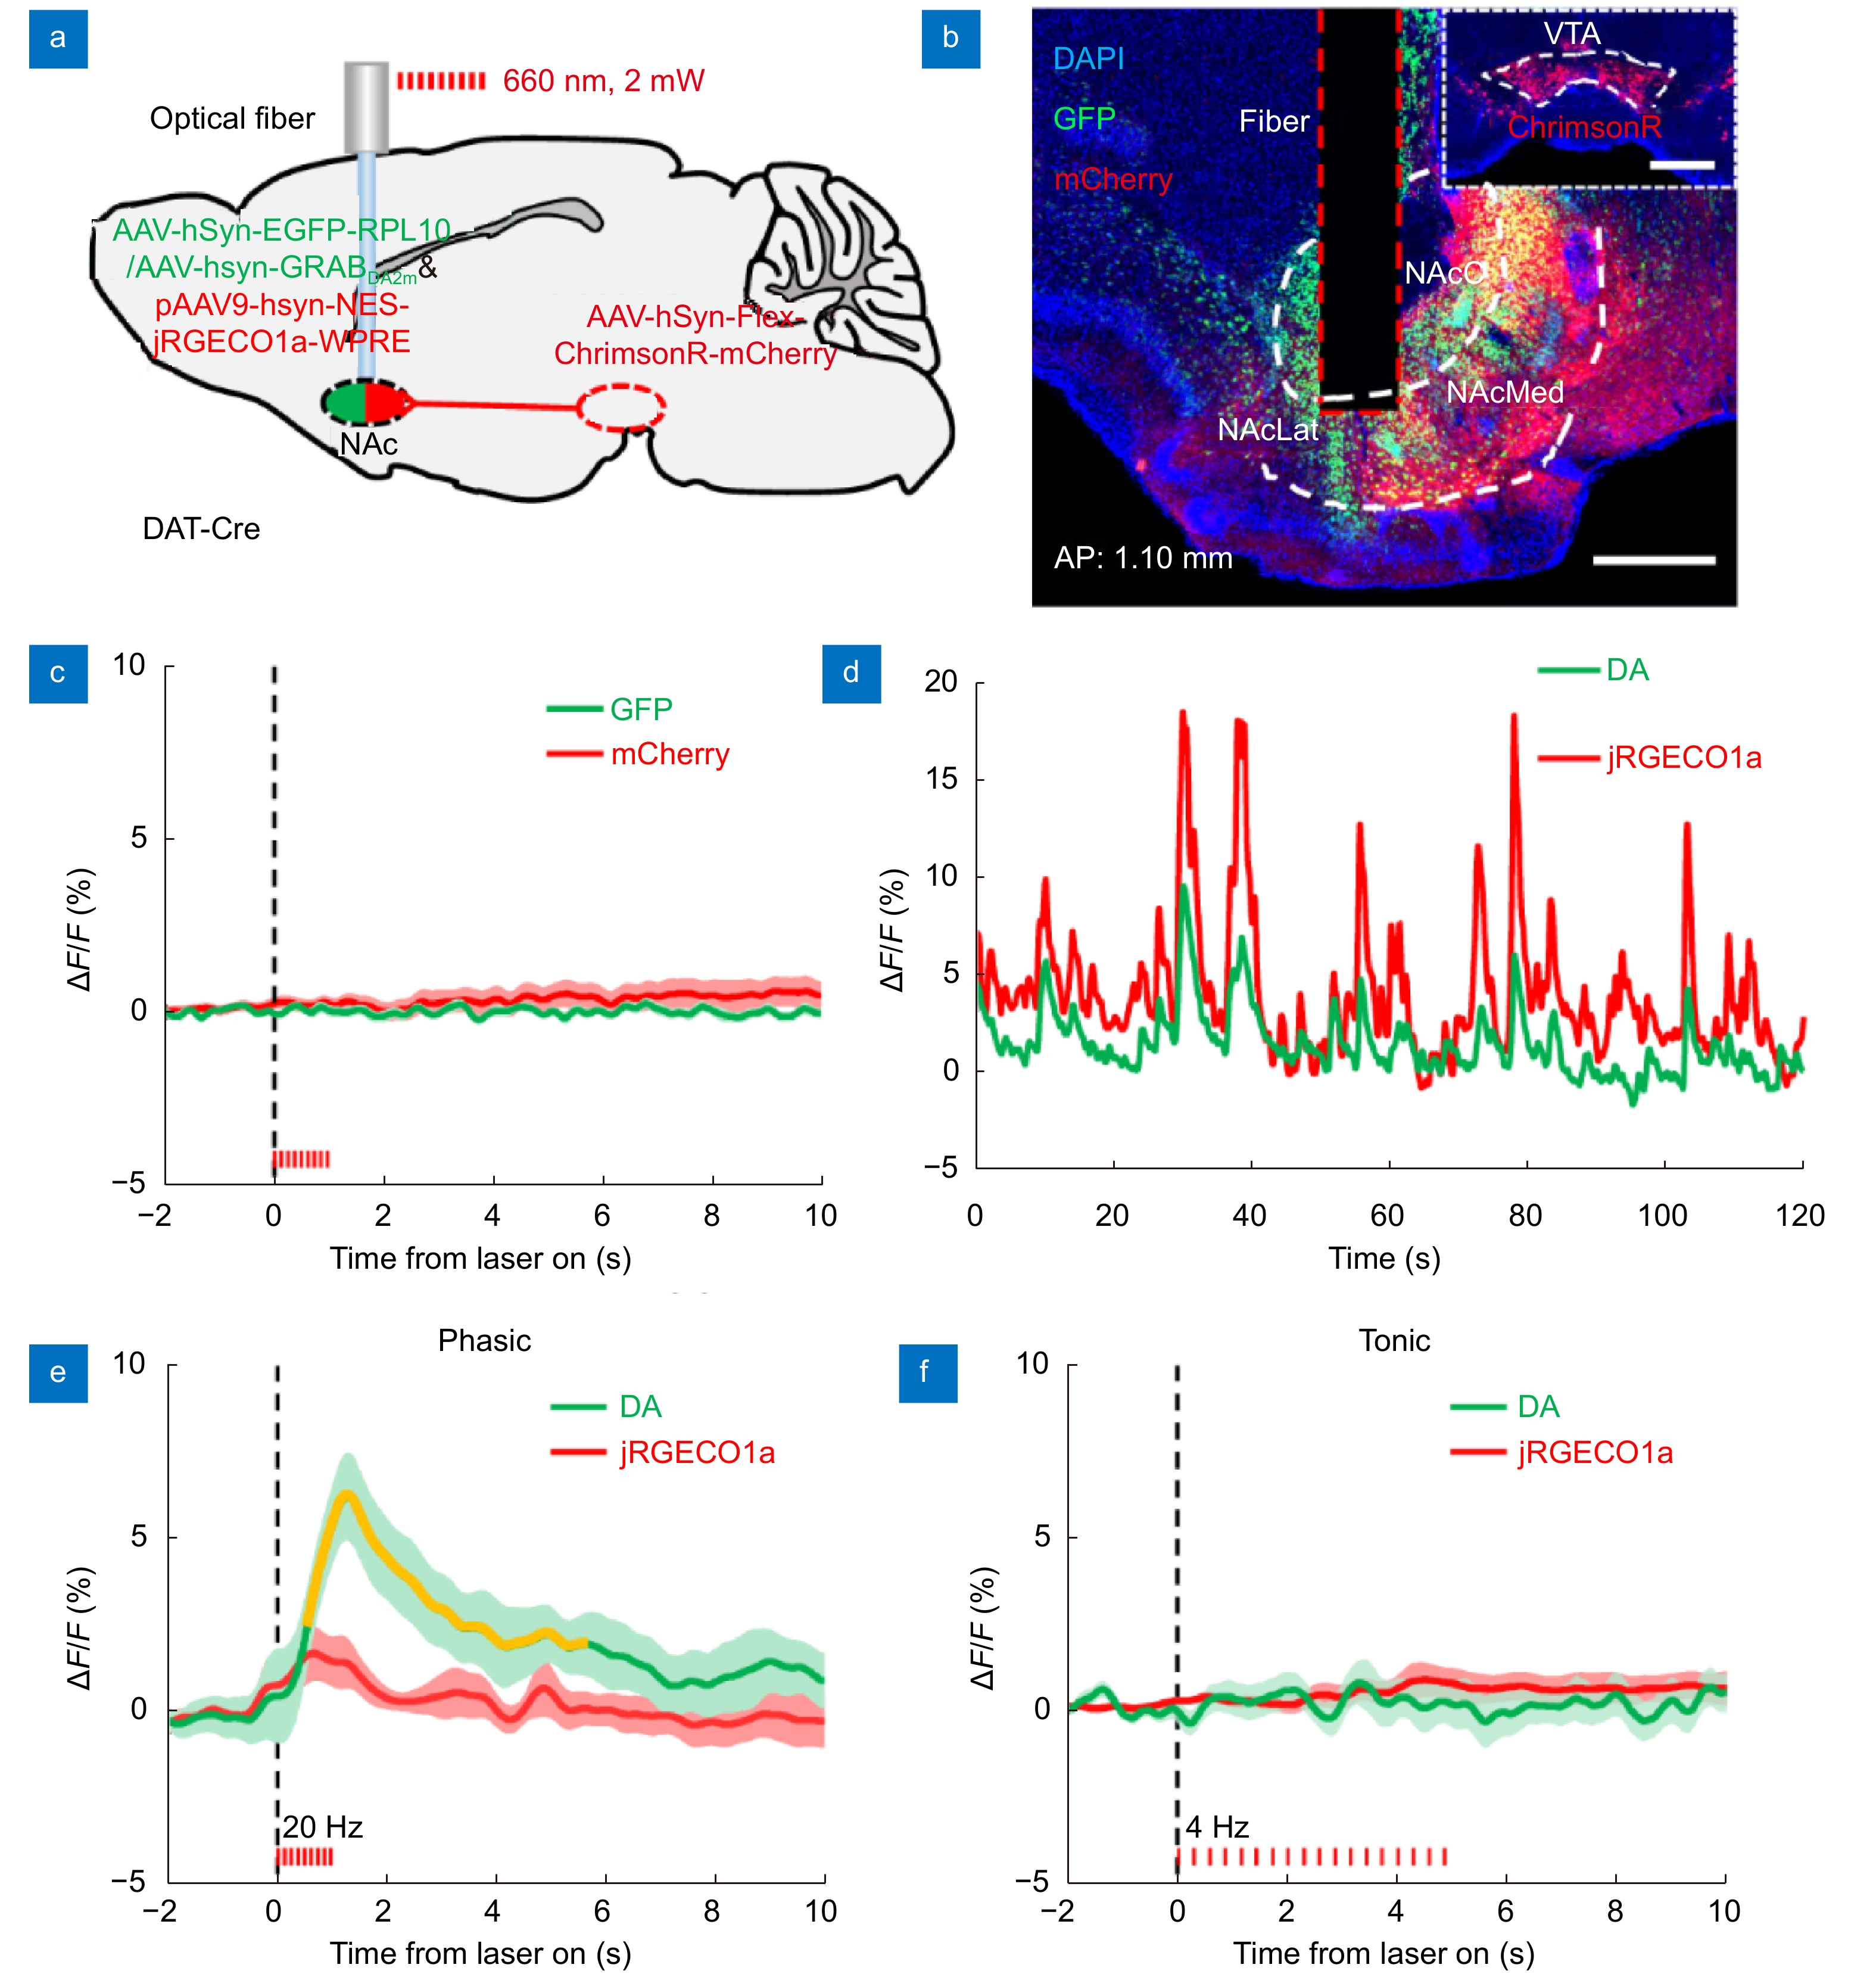
Figure 6.
Simultaneous dual-color recording and optogenetic manipulation of neuronal activities in the NAcLat of a freely moving mouse. (a) Schematic diagram of simultaneous dual-color recording and optogenetic manipulation of neuronal activity surgery: we record GFP and mCherry fluorescence simultaneously, while specifically activating the terminals of VTA-NAc dopaminergic neurons (ChrimsonR: Ex 660 nm) in the NAcLat of a freely moving mouse. Note that GFP was replaced with GRABDA2m and jGRECO1a in subsequent experiments. (b) Histology confirming GFP (green) labeled neurons and ChrimsonR (red) labeled dopaminergic neuron terminal expression in the NAcLat. The brain slice is 1.1 mm anterior to the bregma. Scale bar, 500 μm. (c) No stimulation artifacts exist when simultaneously performing optogenetic manipulation and real-time dual-color recording in this system. The red bar indicates the time of stimulation. (P>0.05, Wilcoxon’s signed-rank test; n = 20 pairs, one mouse). (d) Example of DA and neuronal Ca2+traces simultaneously recorded in the NAcLat of a freely moving mouse. (e) Averaged DA signal and neuronal Ca2+ signal transients in response to phasic optogenetic stimulation (10 trials). The red bar indicates the time of stimulation. The pulse duration is set to 20 ms at 20 Hz, and lasts for 1 s in each trial. Orange segments indicate a statistically significant increase from the baseline (*P<0.05, Wilcoxon’s signed-rank test; n = 10 pairs, one mouse). (f) Averaged DA signal and neuronal Ca2+ signal transients in response to tonic optogenetic. The red bar indicates the time of stimulation. The pulse duration is set to 10 ms at 4 Hz, and lasts for 5 s in each trial. No significant fluorescence changes are detected in the DA signals or the neuronal Ca2+ signals. (P>0.05, Wilcoxon’s signed-rank test; n = 10 pairs, one mouse). Abbreviations: DA, dopamine; NAc, nucleus accumbens; NAcC, nucleus accumbens core; NAcLat, nucleus accumbens lateral shell; NAcMed, nucleus accumbens medial shell.


