E-mail Alert
 RSS
RSS-
Abstract
Photoacoustic imaging (PAI) is a noninvasive biomedical imaging technology capable of multiscale imaging of biological samples from organs down to cells. Multiscale PAI requires different ultrasound transducers that are flat or focused because the current widely-used piezoelectric transducers are rigid and lack the flexibility to tune their spatial ultrasound responses. Inspired by the rapidly-developing flexible photonics, we exploited the inherent flexibility and low-loss features of optical fibers to develop a flexible fiber-laser ultrasound sensor (FUS) for multiscale PAI. By simply bending the fiber laser from straight to curved geometry, the spatial ultrasound response of the FUS can be tuned for both wide-view optical-resolution photoacoustic microscopy at optical diffraction-limited depth (~1 mm) and photoacoustic computed tomography at optical dissipation-limited depth of several centimeters. A radio-frequency demodulation was employed to get the readout of the beat frequency variation of two orthogonal polarization modes in the FUS output, which ensures low-noise and stable ultrasound detection. Compared to traditional piezoelectrical transducers with fixed ultrasound responses once manufactured, the flexible FUS provides the freedom to design multiscale PAI modalities including wearable microscope, intravascular endoscopy, and portable tomography system, which is attractive to fundamental biological/medical studies and clinical applications.
Keywords
-
Introduction
Optical ultrasound sensors have compact sizes, broad bandwidth and high sensitivity per unit area, opening up new possibilities for the implementation of multiscale PAI7-16. Based on their configurations, optical ultrasound sensors can be classified into free-space sensors and fiber/waveguide integrated sensors. Free-space sensors rely on the detection of ultrasonically-induced beam deflection7, surface displacement8, local reflective index modulation9, laser speckle correlation change10, or intensity change associated with surface plasmon resonance11, Fresnel reflections12 or 2D materials13. These sensors offer noninvasive ultrasound detection and potential of integration with other interferometry-based sensing and imaging modalities, such as optical coherence tomography. The fiber/waveguide integrated sensors are comprised of a high-Q optical resonator in an optical fiber or a transparent substrate that is interrogated by a bus waveguide14-18. These sensors can offer much higher sensitivity per unit area/volume than piezoelectric sensors and a bandwidth as large as hundreds of megahertz. Their submicron dimension can also facilitate the near-field ultrasound sensing and imaging19.
Here, we report our progress in the development of flexible fiber-laser-based ultrasound sensing technology and its applications in multiscale photoacoustic imaging. Section Interaction between ultrasound waves and an optical fiber describes the principle of ultrasound interaction with an optical fiber, where both an exact scattering model and an equivalent spring-mass model are illustrated. We particularly emphasize the principle of ultrasound sensitivity tuning by controlling the bending curvature of the fiber sensor. Section Fiber-laser-based ultrasound detection demonstrates the sensor configuration and characterization. Section Photoacoustic microscopy illustrates the optical-resolution, fast-scanning photoacoustic microscopy process using a straight sensor. Section Photoacoustic computed tomography (PACT) shows the circular scanning and linear scanning PACT with a curved fiber-laser sensor with tunable focus. Finally, section Conclusion and outlook provides a conclusion and discusses future developments and applications of fiber-based photoacoustic imaging technology.
In recent years, we have developed a fiber laser sensing technology by exploiting the inter-polarization beat note as the sensing signal25, 26. By taking advantage of the extremely narrow linewidth and the common-noise cancellation, the sensor presents the capability to detect weak acoustic signals, particularly the ultrasound signals at medical frequencies. Compared to the well-known interferometry or high-Q cavity-based sensors, the fiber laser sensor has an outstanding performance in sensitivity, bandwidth and stability. Inspired by the rapidly-developing flexible photonics, we have further exploited the inherent flexibility and low-loss features of optical fibers to develop a flexible fiber-laser ultrasound sensor (FUS) for multiscale PAI. By simply bending the fiber laser from straight to curved geometry, the spatial ultrasound response of the FUS can be tuned for PAM to realize micrometer-scale resolution imaging at millimeters deep and PACT to implement centimeter-deep macroscopic imaging with tens of micrometers resolution. Compared to traditional piezoelectrical transducers with fixed ultrasound response, the flexible FUS provides the freedom for the design of multiscale photoacoustic imaging modality including wearable micro/mesoscope, intravascular endoscopy, and photoacoustic tomography system.
Biomedical imaging technology has revolutionized life sciences and medical care by providing images with high spatiotemporal resolution, deep penetration, and rich contrast. In recent years, multiscale imaging has been pursued to better understand physiological and pathological information in tissues of interest1. Among the widely used imaging modalities, optical microscopy has spatial resolutions at subcellular level but a shallow imaging depth due to the optical scattering of biological tissues. Ultrasonography employed less-scattering ultrasound to penetrate deep into human organs while the spatial resolution is limited by the longer wavelength of the ultrasound than that of the light. In contrast, photoacoustic imaging (PAI) working in a hybrid mode, with optical excitation and ultrasound detection, offers the possibility to break the resolution-depth limit2-4. PAI can be classified into two major representative categories: photoacoustic microscopy (PAM) and photoacoustic computed tomography (PACT). PAM utilizing confocal/loosely-focused excitation light and focused ultrasound detection can achieve an optical diffraction-limited spatial resolution5. And PACT employing diffusive light illumination and unfocused ultrasound detection can achieve deep-tissue imaging with reconstruction algorithms6. The two different categories for multiscale imaging require flat or focused transducers with different focal lengths to adapt to practical needs. Currently, the widely used piezoelectric transducers are rigid and their spatial ultrasound responses cannot be tailored once manufactured.
In the 1970s, a fiber-optic sensor was developed to detect underwater acoustic waves at audible frequencies for defense applications20, 21. The acoustically induced optical-phase change can accumulate over the entire fiber length to yield a high sensitivity. An optical fiber is inherently sensitive to ultrasound waves at MHz frequencies, which are of medical interest22, 23. The ultrasonically induced phase change has a frequency- and polarization-dependent response. However, its application in ultrasound sensing and imaging was significantly hindered because of the corresponding extremely short acoustic wavelength. In many cases, the response is hardly detectable due to the weak interaction between the optical fiber and the ultrasound waves. In the 1990s, fiber laser sensing technology, which exploits a compact intra-core fiber laser as a sensing element, was proposed and developed24. A laser cavity, typically several millimeters to centimeters long, contains a phase-shifted Bragg grating or a grating pair that offers strong optical feedback. The high-concentration rare-earth dopant can provide a sufficiently high gain for laser emission. The acoustically induced lasing frequency can be determined with interferometry. This approach offers a high sensing resolution due to the narrow linewidth and high signal-to-noise ratio of the laser output. The fiber-laser-based acoustic sensor is advantageous because of its small size and intrinsic multiplexing capability.
Interaction between ultrasound waves and an optical fiber
Scattering model
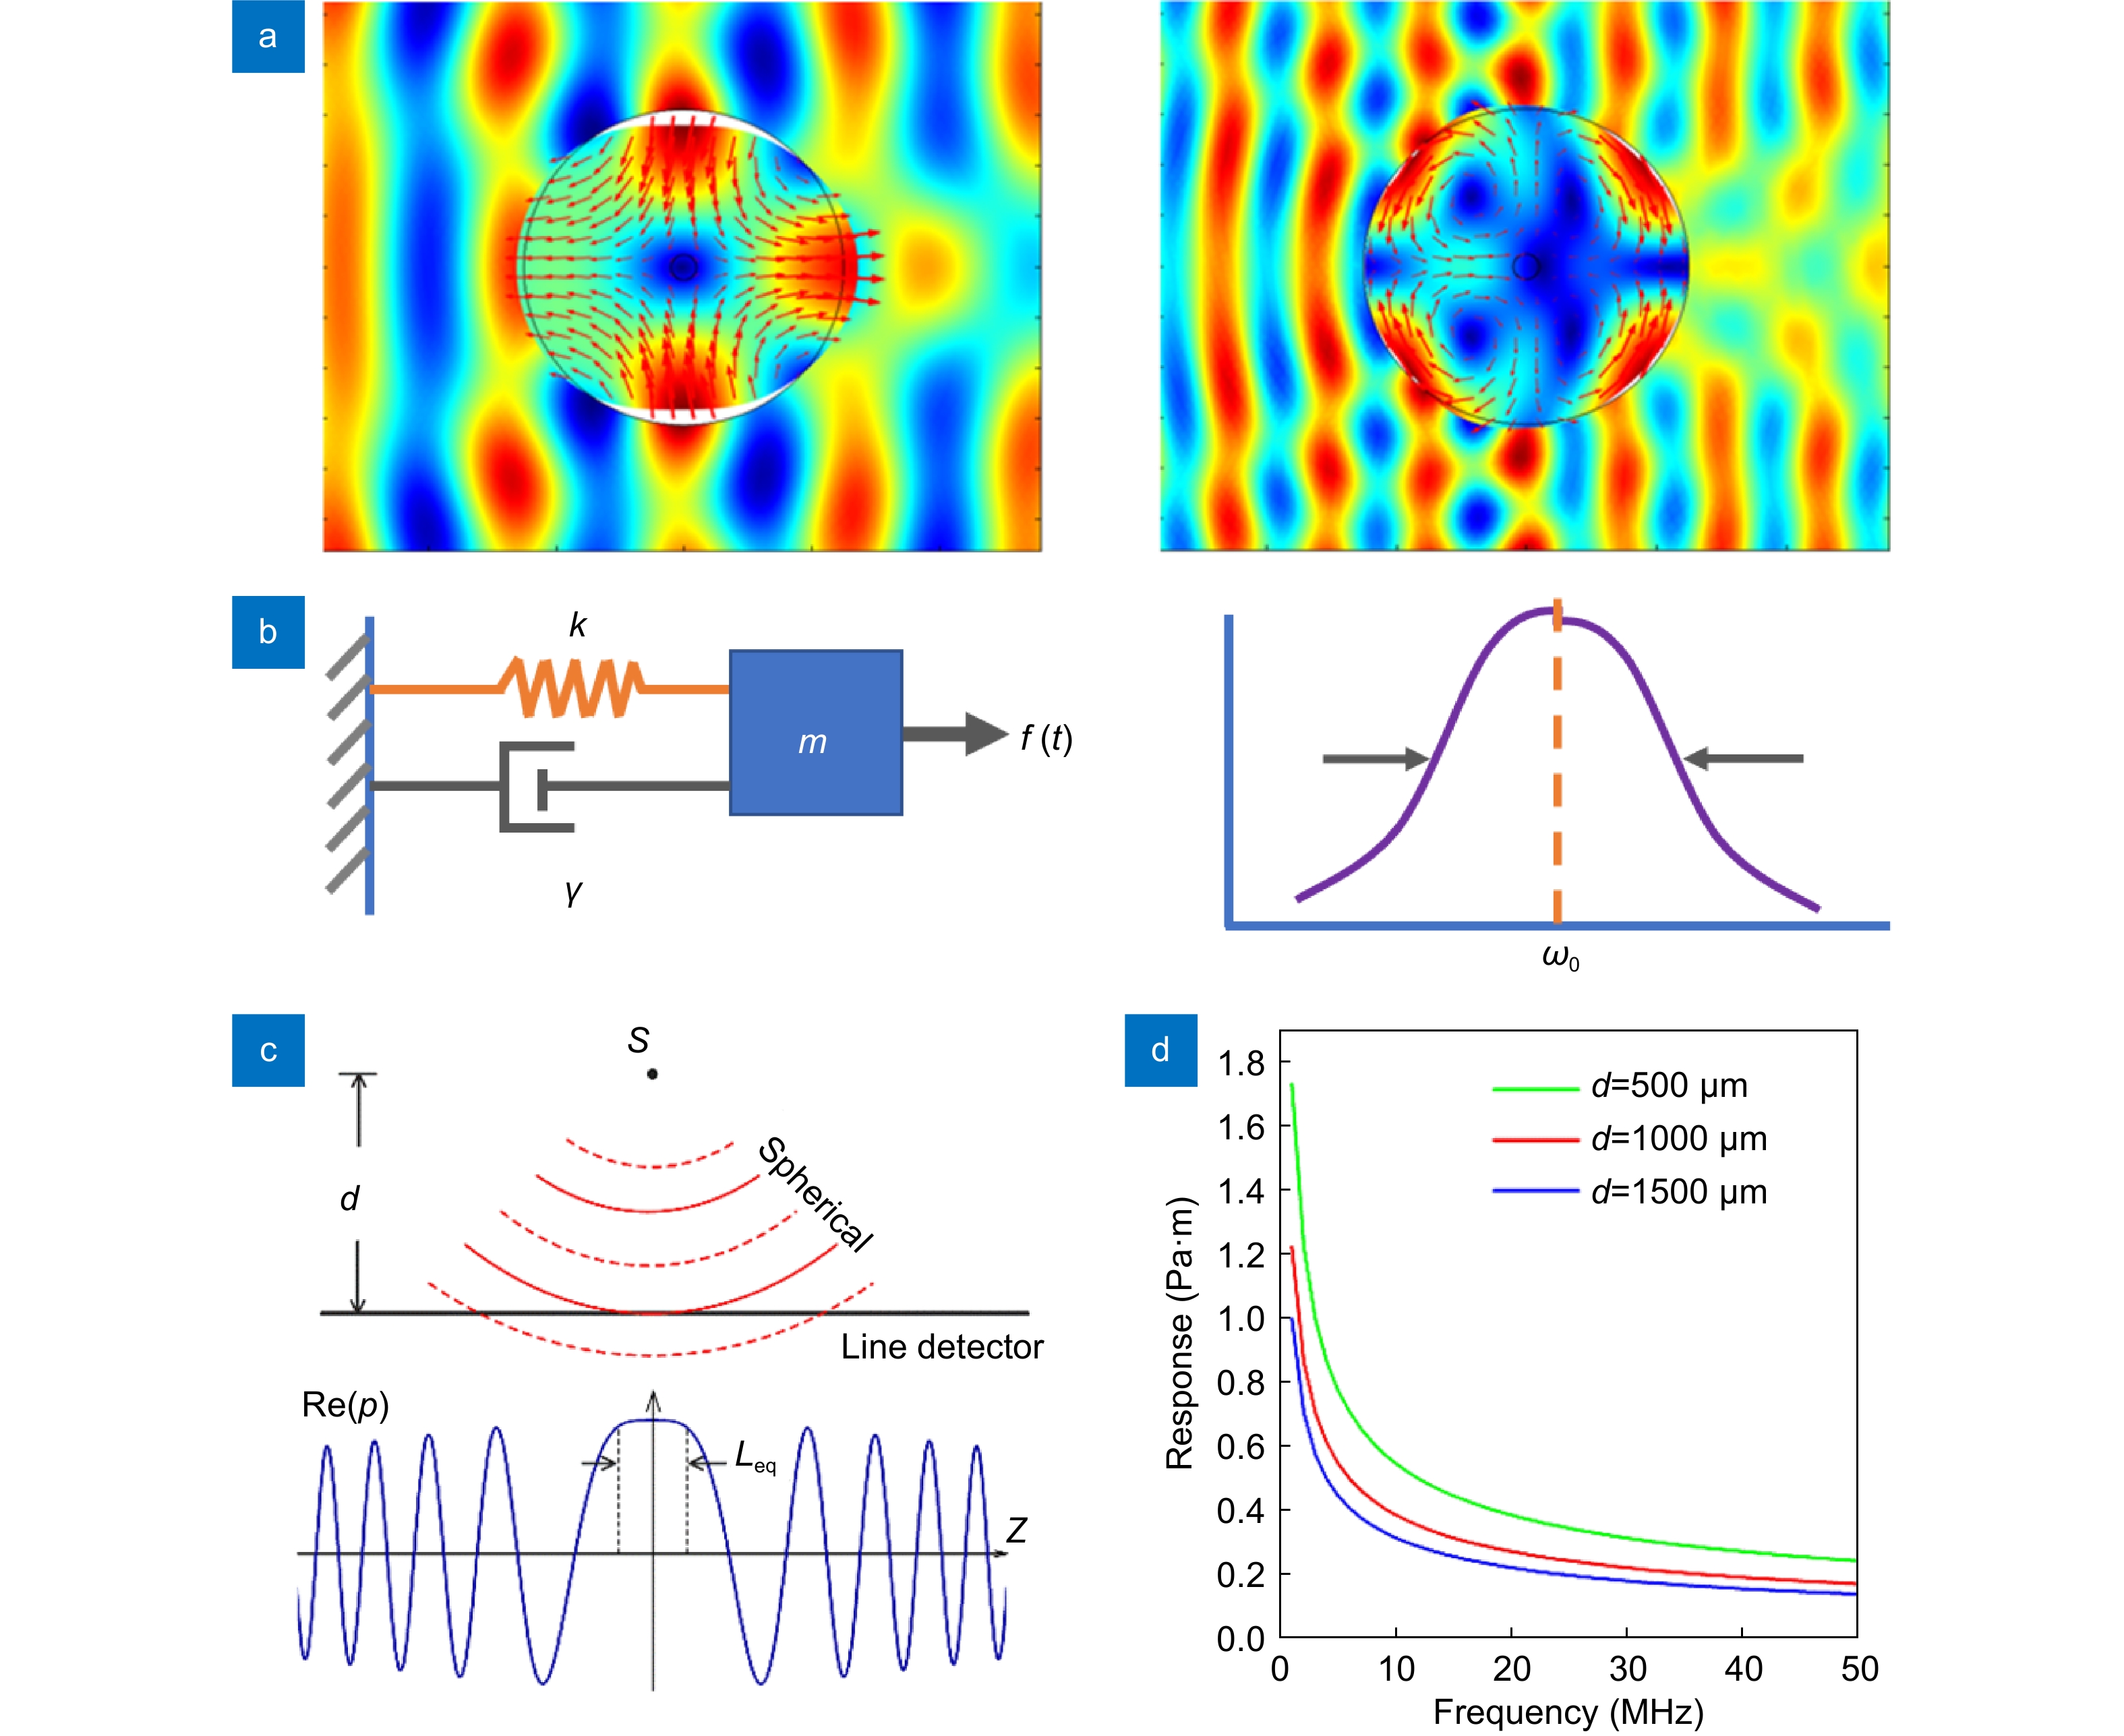
Exact calculation of the ultrasound response relies on a scattering model. Here, the interaction between the ultrasound wave and the fiber is described as acoustic scattering as a result of the difference in elastic properties. This incident pressure wave excites a vibration mode in the fiber, and the scattered wave varies the acoustic field in the surrounding fluid medium. In this model, the incident wave is decomposed as a linear summation of cylindrical waves with l=0, 1, 2… as input signals. The induced amplitude and phase of the l=0 or 2 modes can be respectively calculated by solving decoupled Helmholtz equations in combination with continuity boundary conditions. Figure 1(a) shows the example of TR21 and TR22 vibration modes when subjected to normally incident planar pressure waves at 22 and 39 MHz, respectively. Despite the profile of the input acoustic waves, only the cylindrical-wave component with l=2 is responsible for the excitation of these vibrations. In ref.23, the frequency response for both the x- and y-polarizations are plotted. The individual peaks correspond to different vibration modes. The calculated curves are determined by overlapping the individual l=0 and 2 peaks. The scattering model can be extended to the case of oblique incidence. A full description of the dependence on incidence angle has been provided in ref.27.
In acoustics, a bare optical fiber can be treated as a homogeneous elastic cylinder. The transverse profiles of fiber vibrations can be calculated by solving the acoustic wave equations22, 23, 27. Briefly, the longitudinal and shear waves in the optical fiber can be respectively expressed by scalar and vectorial potentials written in the first-kind Bessel functions. The eigenfrequency and the displacement/stress profile of each mode can be solved with material parameters including the density and acoustic velocities of the silica glass as well as the free boundary conditions. Among all the vibration modes, only the groups with azimuthal mode indices l=0 and 2 can effectively cause an optical phase change based on the photoelastic effect. The former group, denoted as R0n modes, where n represents the radial mode index, has axially symmetric profiles with isotropic stresses at the fiber core. The latter group, denoted as torsional-radial TR2n modes, is a hybridization of longitudinal and shear waves. They compress and stretch the fiber core in the two orthogonal directions and induce a phase change with equal amplitudes but opposite signs (or π phase offset).
![Figure 1. (a) The calculated deformations of the fiber surrounded by water in response to plane ultrasound waves. Left: TR21 mode at 22 MHz. Right: TR22 mode at 39 MHz. Arrows: local displacement. (b) Analogous model of a spring-mass oscillator. (c) Schematic of the phase cancelation effect. (d) Frequency responses with different source-to-fiber distances.]()
(a) The calculated deformations of the fiber surrounded by water in response to plane ultrasound waves. Left: TR21 mode at 22 MHz. Right: TR22 mode at 39 MHz. Arrows: local displacement. (b) Analogous model of a spring-mass oscillator. (c) Schematic of the phase cancelation effect. (d) Frequency responses with different source-to-fiber distances.
An analogous spring-mass oscillator model
The acoustically induced response can be considered as the weak mechanical resonance of the fiber, which is dampened by the acoustic interaction between the fiber and water. This response is analogous to a dampened harmonic oscillator, for example, a spring-mass oscillator, as shown in Fig. 1(b). In this model, the mass m is tied to a spring with a Hook’s coefficient k. The vibration is driven by an external force f(t) and dampened with a coefficient γ. According to Newton’s second law, the frequency response has a Lorentz profile 1/[i(ω0−ω)+ω0γ]. The induced vibration can be characterized by a central frequency at ω0=(k/m)1/2 and a quality factor Q=(m·k)1/2/γ. Now consider the vibration of the optical fiber immersed in water. In the two-dimensional case, for simplicity, the eigenfrequency of a vibrational mode is determined by the elastic and geometric parameters of the fiber, including the density, acoustic velocities, and fiber diameter. Taking an ordinary 125-μm silica optical fiber as an example, the vibrational frequencies of the R01 and TR21 modes are approximately 29 and 22 MHz, respectively. Its vibration is driven by the applied ultrasound and dampened by the surrounding water. The differences between the cylinder vibration and the spring-mass oscillator are as follows: First, the cylinder vibrates in different modes, which can be denoted with an azimuthal order l and radial order n. Among all the vibration modes of an optical fiber, the axially symmetrical modes (with l=0) and torsional-radial modes (with l=2) can induce optical-phase changes. Second, the frequency response of the cylinder vibration is expressed by Bessel functions of kart, where ka and rt denote the acoustic wavenumber and radial position. Therefore, this response somewhat deviates from the well-known Lorentz curve.
Response of a straight fiber to a spherical pressure wave
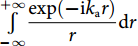
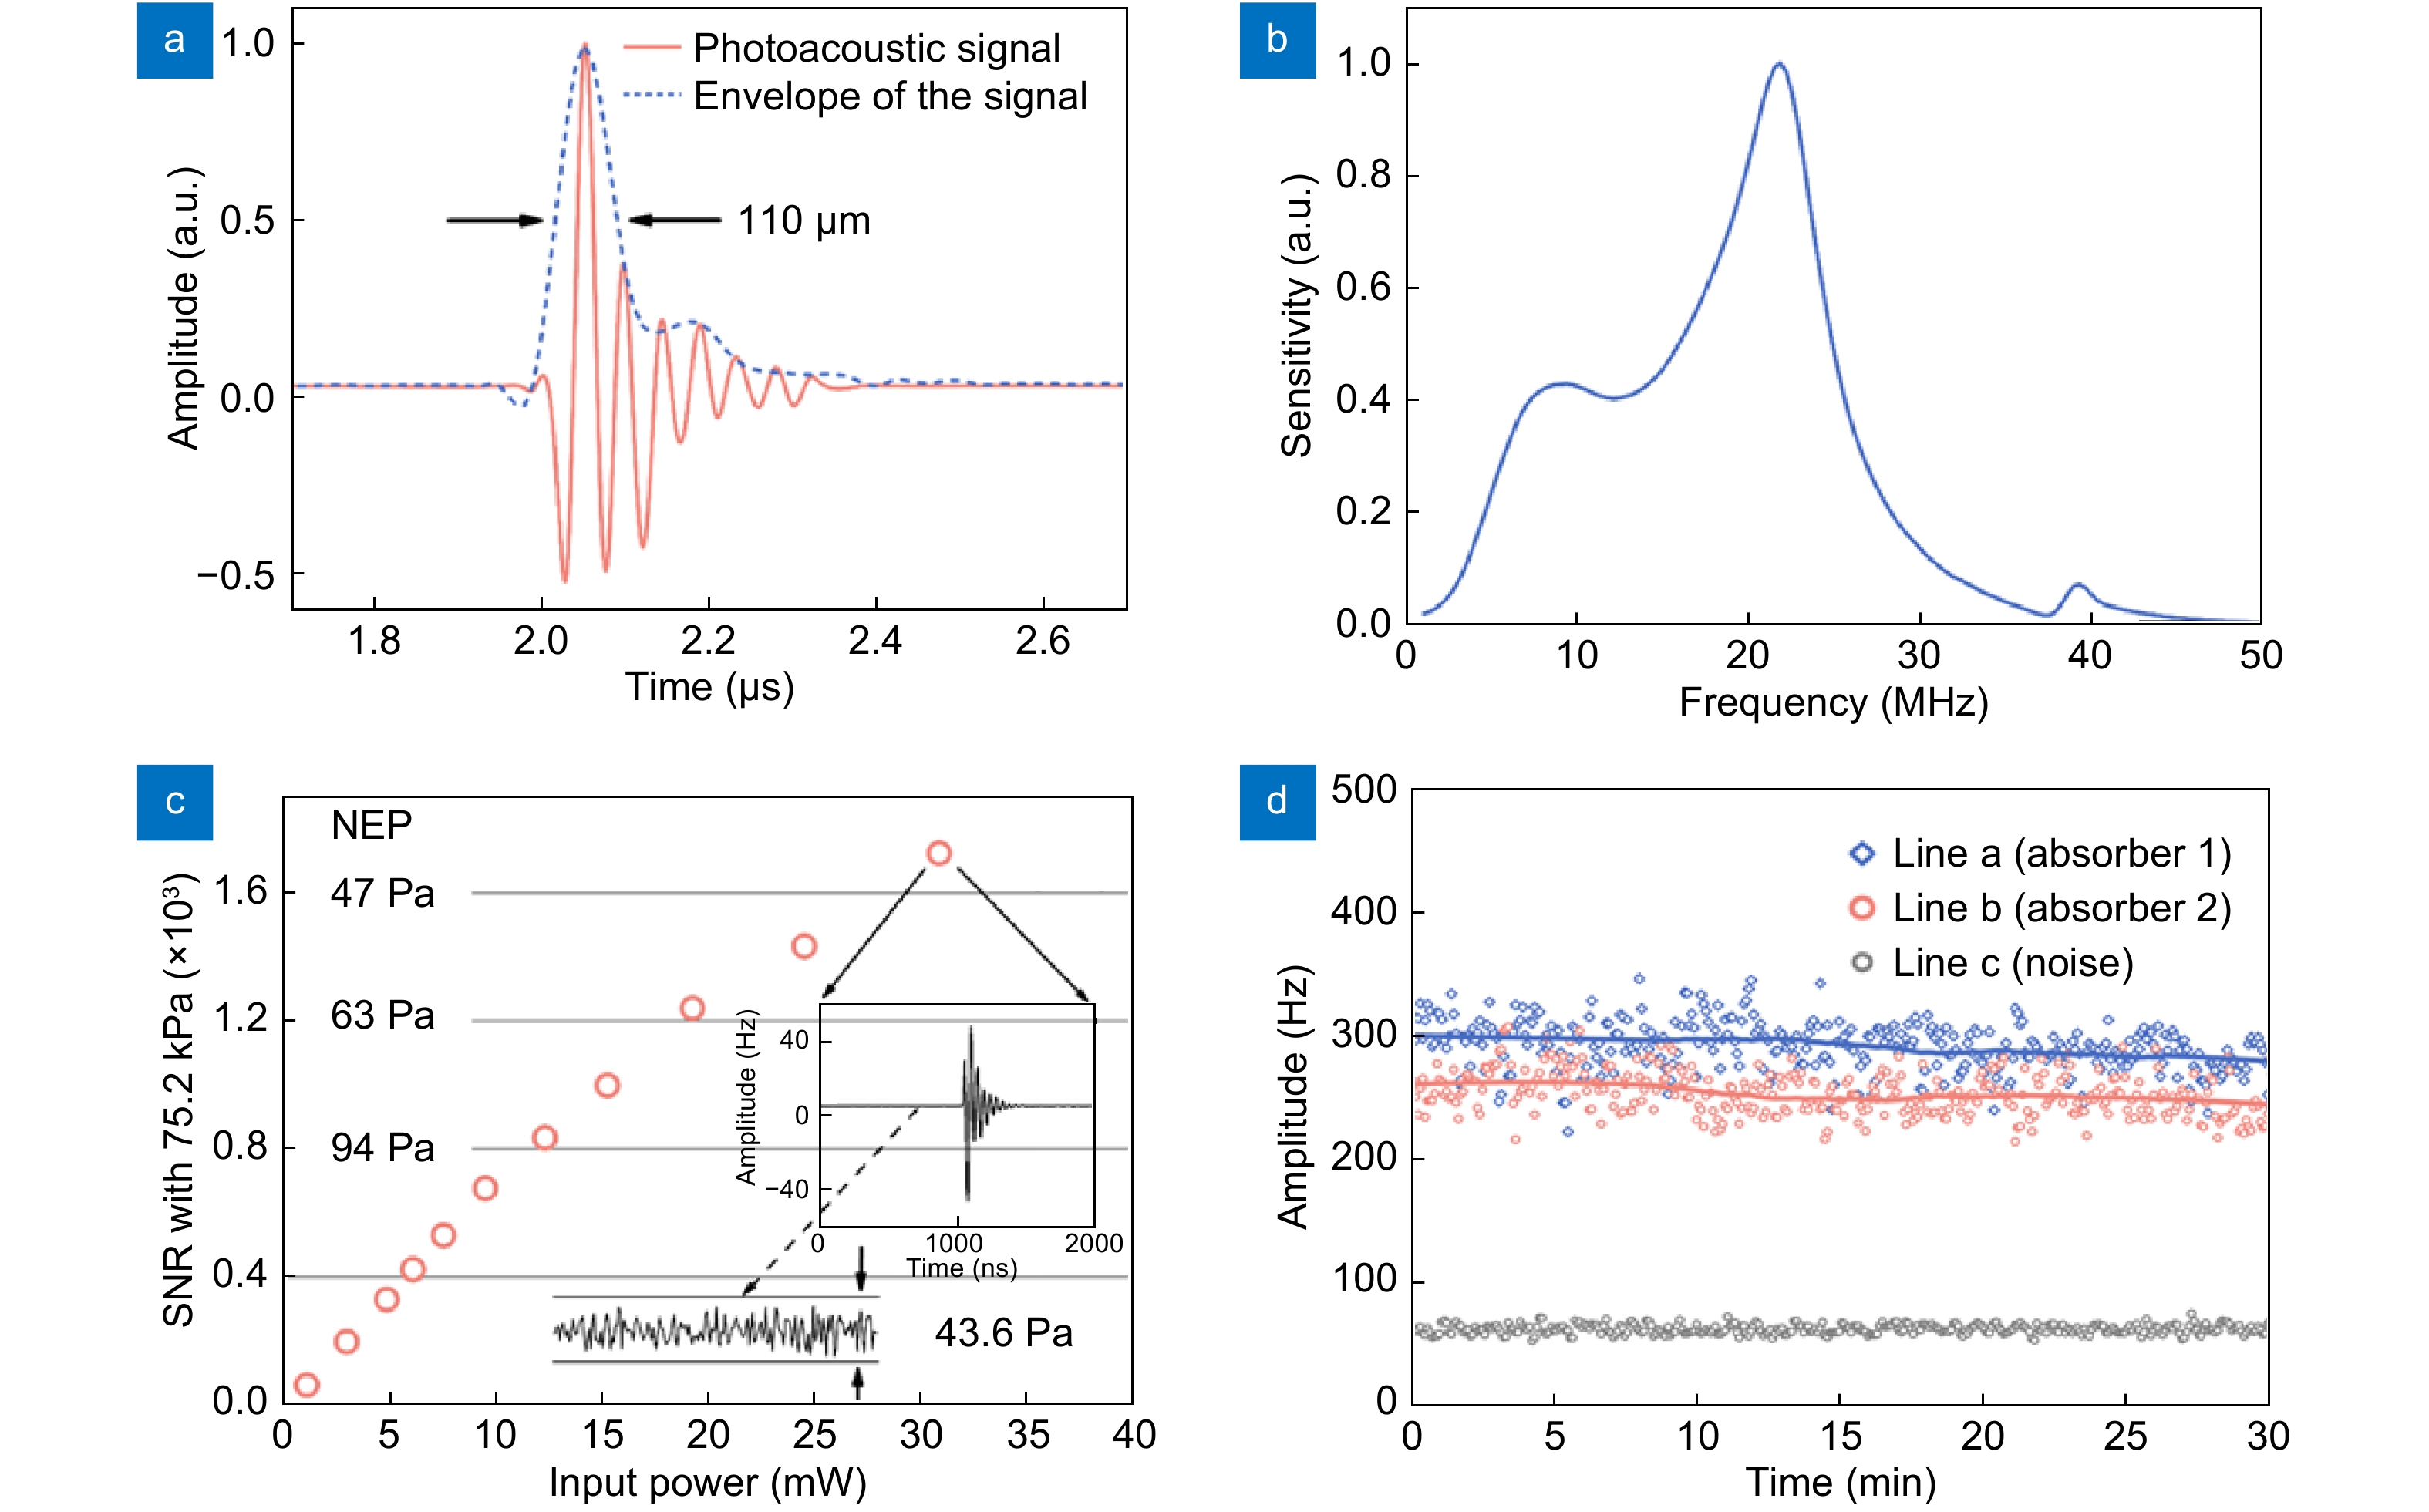
It is worth noting that the spherical ultrasound waves generated by the individual absorbers are detected with PAI, rather than the plane waves. Here, the acoustic response of an ideal line detector to a spherical wave is discussed. As shown in Fig. 1(c), a point source S generates an acoustic wave with a frequency fa. Suppose the acoustic wave is totally absorbed by the line detector placed at a distance d. The acoustic pressure propagation can be written as p(ω, r)=exp(−ikar)/r, where r=(d2+z2)1/2 is the propagation distance, and z represents the longitudinal position. The spherical wavefront arrives at the line detector with different phases. The response of the line detector can be expressed as an integration: R =
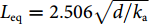
+∞∫−∞exp(−ikar)rdr . Figure 1(d) plots the frequency response, exhibiting that a higher acoustic frequency leads to a reduced sensitivity, which has a 1/fa1/2 variation, as a result of the faster acoustic-phase oscillation along the line detector and the stronger self-cancellation effect. The response can be equivalently considered as an effect of a uniform pressure peq=1/d (the amplitude at the position facing the source z=0) with a length Leq. Based on the deduction above, we can write the equivalent interaction length asLeq=2.506√d/ka , which is ten to a hundred times shorter than the sensitive region (typically 2 to 10 mm) of a fiber laser sensor28. For a 50-MHz spherical ultrasound wave (wavelength: 30 μm; speed in water: 1500 m/s) with a source-detector distance d=500 μm, the equivalent interaction length is Leq=122 μm. Based on the above analysis, we can find that a conventional interferometric sensor, which relies on a proportional sensitivity to the fiber length, is not suitable to detect ultrasound waves with sub-mm wavelengths. To achieve a high SNR, one should enhance the overlap between the ultrasonic interaction region with the optical sensor.Response of a curved fiber to a spherical pressure wave
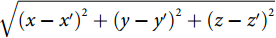
where Г is a coefficient accounting for the absorption or scattering experienced by the sound when traveling from the source S to the fiber and A(ω) is the normalized frequency response of a straight fiber to plane ultrasound waves. The fiber length L, defined as the ultrasound-sensitive zone, is approximately equal to the cavity length of the laser sensor. By varying the locations (x, y, z) of the point source S, the three-dimensional spatial response to ultrasound can be plotted, as shown in Fig. 2(b, c, e, f). Figure 2(b, c) suggests the decaying sensitivity of the straight sensor with increased source-detector distance, described as the phase cancellation effect in the next Section Fiber-laser-based ultrasound detection. By contrast, the curved sensor has a significantly different sensitivity profile, as shown in Fig. 2(e, f). It has maximal sensitivities to the acoustic sources around the focus spot (at x=30 mm) with a 5-fold enhancement, owing to the coincidence between the spherical wavefront and the curved sensor. Notably, the fiber sensor also has a large view angle, yielding an extended field of view over the x-z plane. Therefore, the focal length and the sensitivity profile can be continuously adjusted by bending the fiber sensor into different curvatures, which opens up the possibility of multi-depth imaging. Additionally, the focused acoustic beam has a width of approximately 500 μm in the z direction endowing the sensor with sectioning capability for PAI.
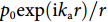
Compared with rigid piezoelectric transducers, optical fibers can be curved into different shapes thanks to the great flexibility of the optical fiber in geometry. The above analysis suggests that the variation in the acoustic phase along with the fiber largely determines the sensitivity and the frequency response. This implies a potential degree-of-freedom in the sensitivity enhancement by bending the fiber to coincide with the spherical wavefront29. Ultrasound focusing at a depth is achieved by simply adjusting the bending curvature of a fiber sensor. The capability of controlling the ultrasound sensitivity is demonstrated by plotting the spatial sensitivity profile of a straight and a curved fiber sensor with a curvature radius of 30 mm in Fig. 2. Both sensors are subjected to the ultrasound field generated by a point ultrasound source S at a position (x, y, z). The source emits spherical pressure waves, with a pressure profile that can be described as
p0exp(ikar)/r , where p0 denotes the initial pressure amplitude,ka=ω/va is the ultrasound wavenumber, va is the ultrasound velocity in the surrounding medium and r =√(x−x′)2+(y−y′)2+(z−z′)2 denotes the source-detector distance. When spherical ultrasound waves impinge on the sensor with an effective length of L, the response of the fiber sensor can be obtained byRu=Γp0A(ω)∫Lexp(ikar)rdL, ![Figure 2. (a, d) Schematics of a straight sensor and curved (bending radius R=30 mm) sensor subjected to a point ultrasound source. The dashed curves show the acoustic phase variation along the fiber. (b–c) Calculated spatial sensitivities of a straight sensor in the x-z and x-y planes. (e–f) Calculated spatial sensitivities of a curved sensor in the x-z and y-z planes. Figure reproduced with permission from ref.29, Optical Society of America.]()
(a, d) Schematics of a straight sensor and curved (bending radius R=30 mm) sensor subjected to a point ultrasound source. The dashed curves show the acoustic phase variation along the fiber. (b–c) Calculated spatial sensitivities of a straight sensor in the x-z and x-y planes. (e–f) Calculated spatial sensitivities of a curved sensor in the x-z and y-z planes. Figure reproduced with permission from ref.29, Optical Society of America.
Fiber-laser-based ultrasound detection
The ultrasound sensing system
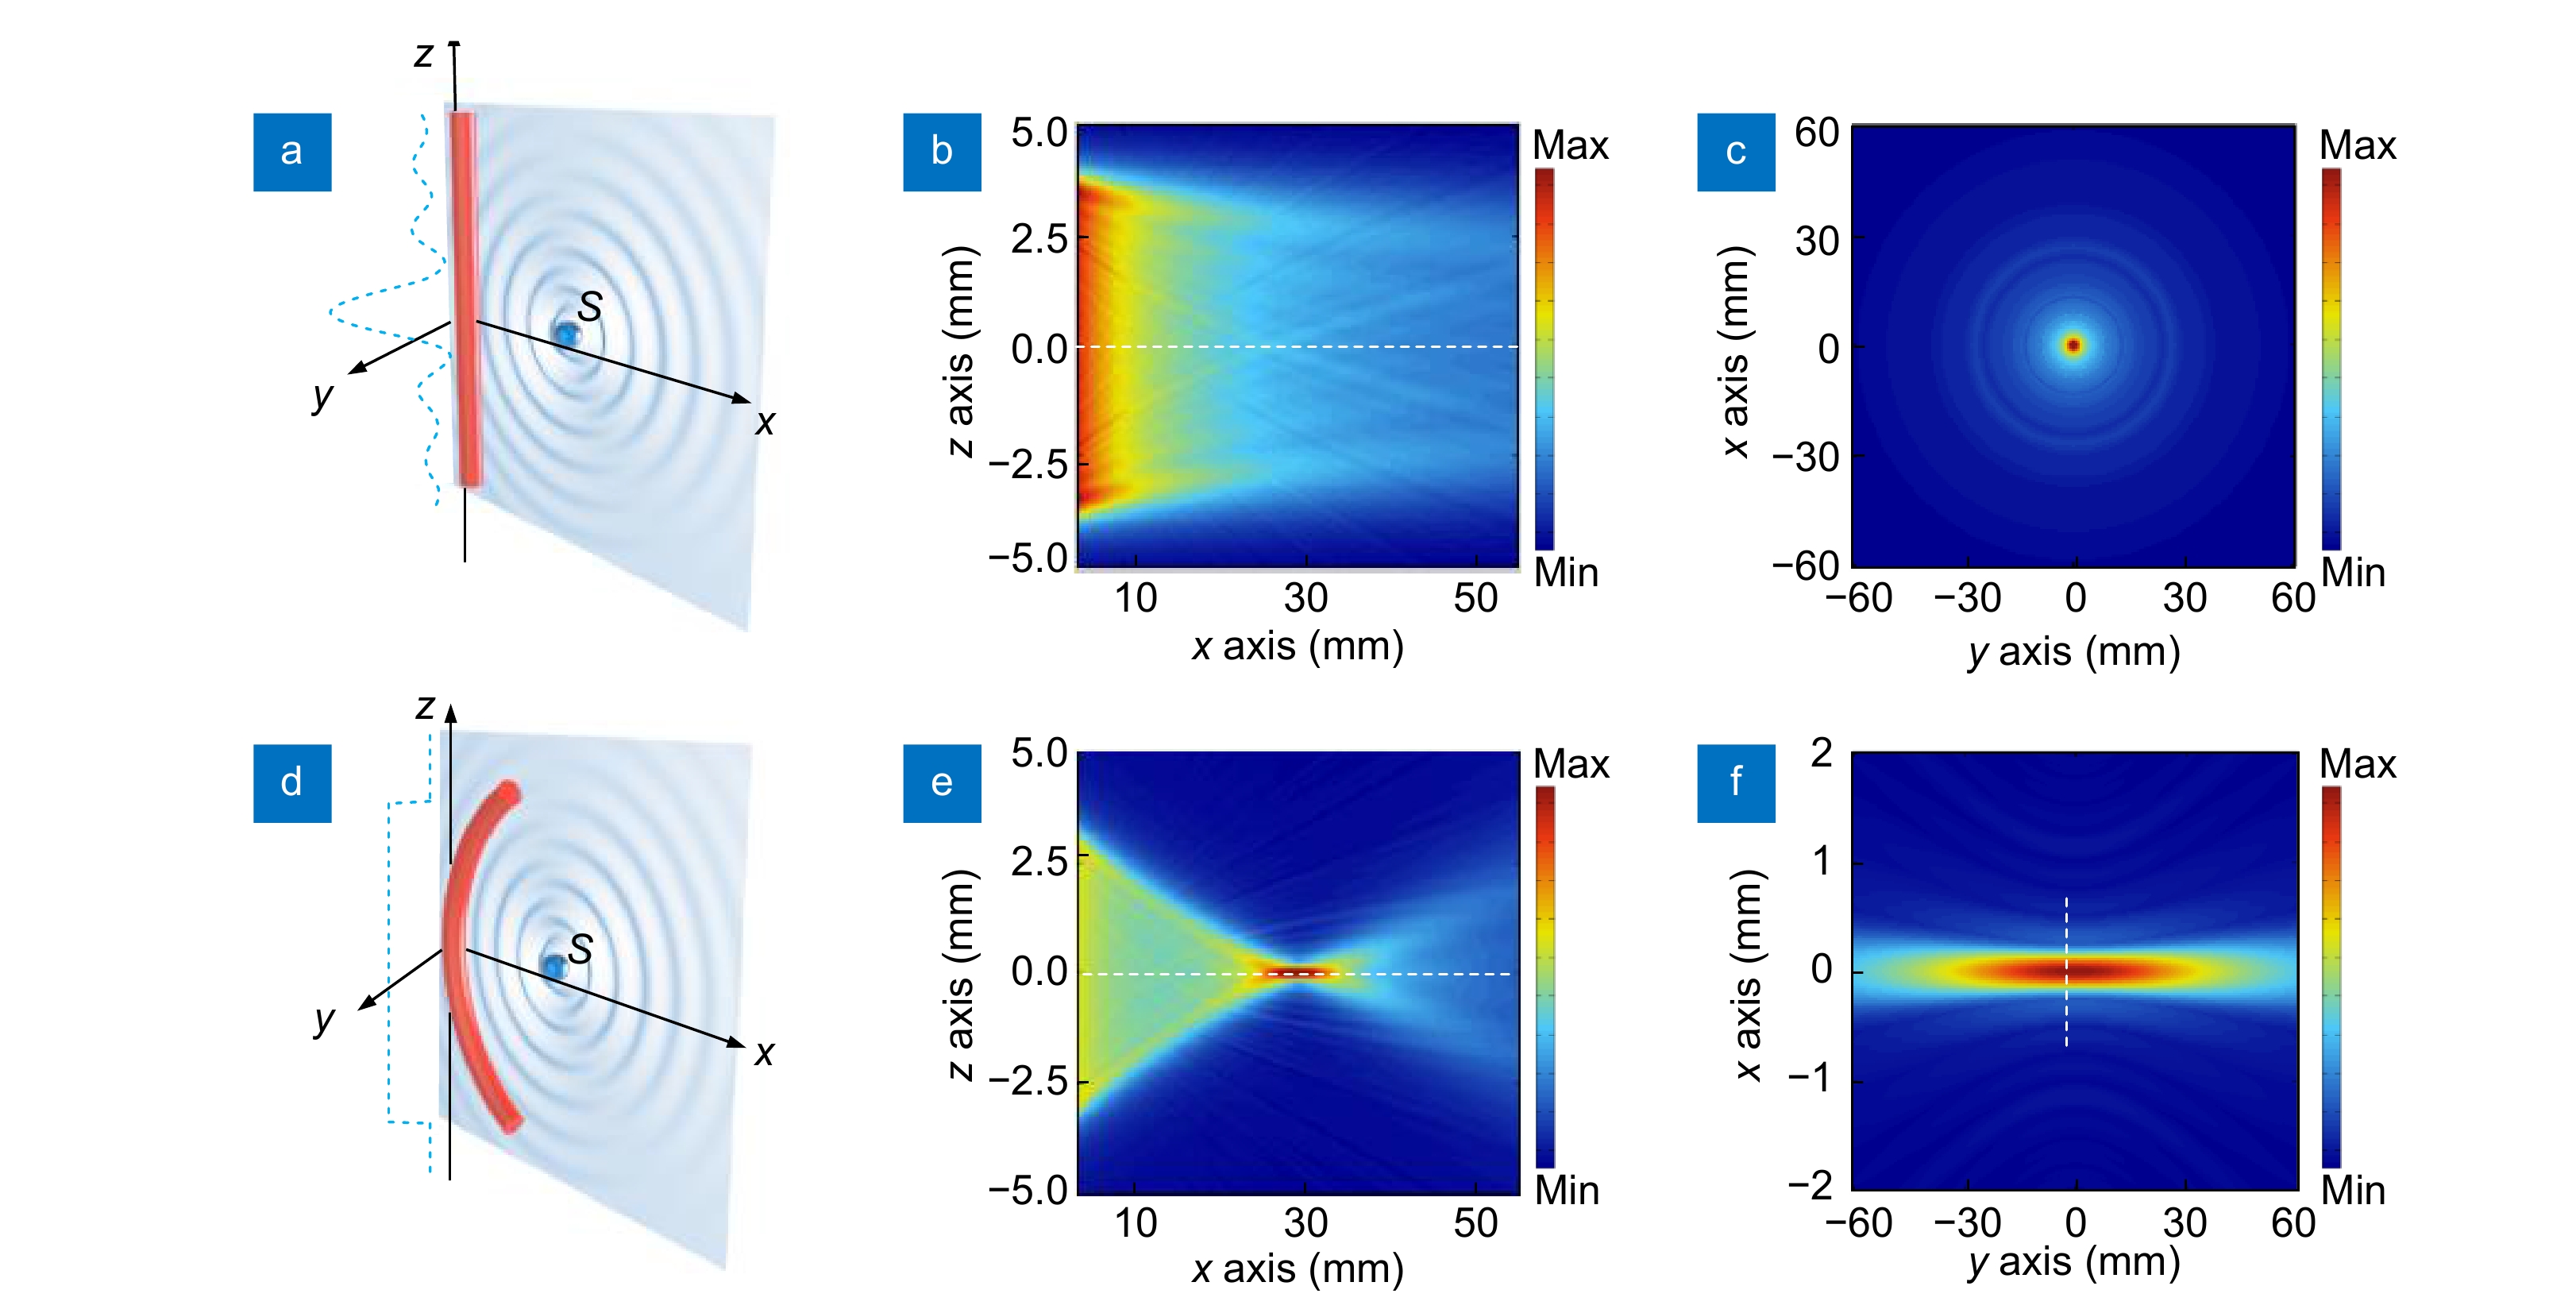
fm=cn0λdB. Notably, the dual-polarization operation is important for ultrasound detection. For the l=2 vibration modes, the x- and y-polarized modes present equal but opposite refractive-index changes. This birefringence change can be effectively measured by the laser sensor. By contrast, these two modes have almost the same response to thermal, vibrational and other low-frequency perturbations. Therefore, common-mode noise cancelation can ensure a high SNR for ultrasound detection.
![Figure 3. (a) Schematic of ultrasound detection by using a fiber-laser sensor. (b) Unperturbed and ultrasonically perturbed beat signal output from the sensor. Figure reproduced with permission from ref.30, under a Creative Commons Attribution 4.0 International License.]()
(a) Schematic of ultrasound detection by using a fiber-laser sensor. (b) Unperturbed and ultrasonically perturbed beat signal output from the sensor. Figure reproduced with permission from ref.30, under a Creative Commons Attribution 4.0 International License.
Figure 3(a) schematically shows ultrasound detection with a fiber-laser-based sensor30. The laser is fabricated by inscribing two strong Bragg gratings in a rare-earth co-doped fiber to form a Fabry-Perot cavity. The cavity length is typically less than 8 mm to ensure a single longitudinal-mode output. The fiber laser operates at the communication band and emits single-longitudinal-mode outputs at both x- and y-polarizations. Because of the weak birefringence of the optical fiber, the two polarization modes have a small difference in the lasing frequency, which generates a radio-frequency beat signal at a photodiode detector. The beat frequency can be expressed by25
where c denotes the light speed in vacuum, n0 represents the refractive index of fiber silica, and λ is the lasing wavelength. The pressure wave can deform the fiber, induce a birefringence change dB and modulate the beat frequency, as shown in Fig. 3(b) and expressed as30
fc=cn0λB, In recent years, ultrasound sensors based on optical resonance have been developed, including planar and fiber-based Fabry-Perot sensors, in-fiber phase-shifted gratings, and polymer microring resonators14-19. These sensors can offer a high sensitivity and a wide detection bandwidth. However, the stable sensor output relies on the frequency locking of the probe light on the quadrature point. This feedback-based locking becomes very difficult for a resonator with a high-quality factor (or Q factor), which hinders its application in PAM. A fiber grating laser can be equivalently viewed as an active resonator, in which the cavity offers a gain instead of a loss. It is a candidate for ultrasound detection because on the one hand, the laser output has a 1/f noise spectrum, and the noise level at MHz frequencies is extremely low, and on the other hand, the measurement of the acoustically induced lasing-frequency change does not necessarily require frequency locking feedback. The heterodyning fiber lasers, which have dual-polarization-mode output, can output radio-frequency beat notes, whose frequency can be read out with a commercial photodetector.
The acoustically modulated beat signal can be measured via I/Q demodulation. Briefly, the beat signal is mixed with two quadrature radio frequency signals, which have the same frequency and 90-degree phase offset. After mixing, the two baseband signals I and Q are used to recover the modulated signal. The phase information can be extracted via ϕ = arctan(Q/I). The variation in the frequency of the beat signal is then recovered by taking the derivative of the phase.
Sensor characterization
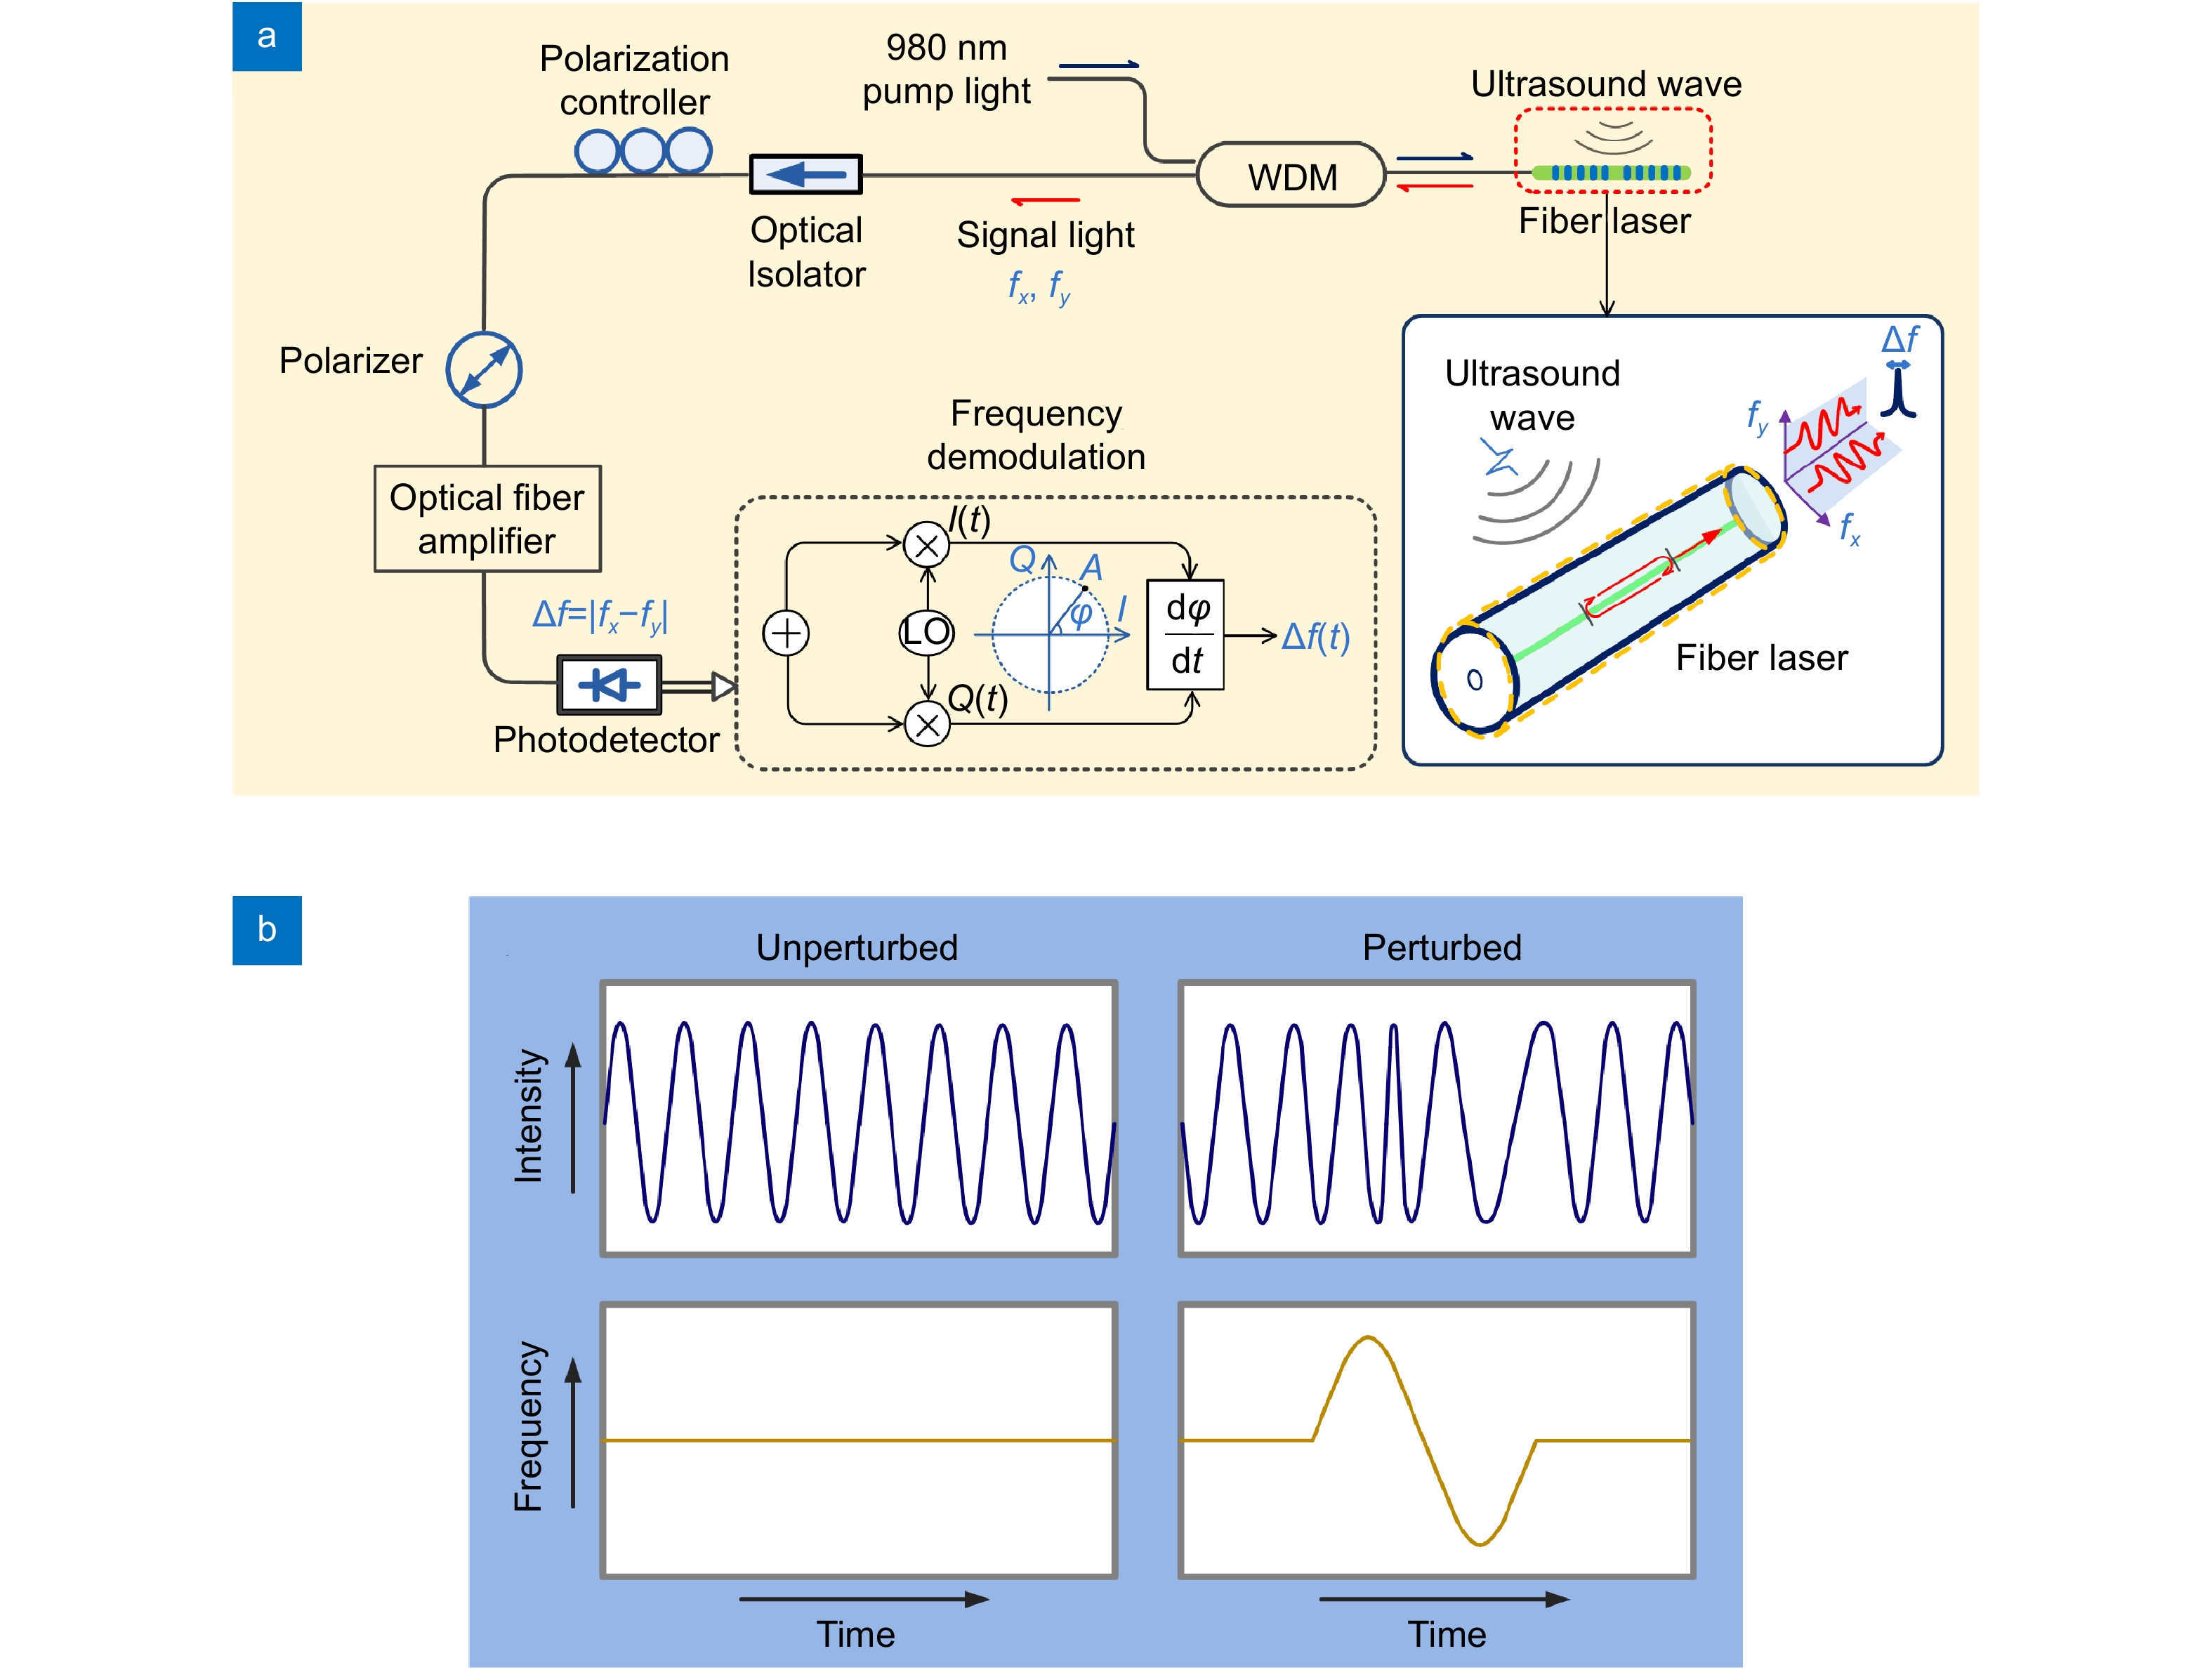
![Figure 4. (a) Temporal and (b) frequency response of the sensor. (c) Measured NEP as a function of input power at the photodetector. (d) Stability test result by continuously measuring the photoacoustic signals from two discrete absorbers over 30 min. Figure reproduced with permission from ref.31, Optical Society of America.]()
(a) Temporal and (b) frequency response of the sensor. (c) Measured NEP as a function of input power at the photodetector. (d) Stability test result by continuously measuring the photoacoustic signals from two discrete absorbers over 30 min. Figure reproduced with permission from ref.31, Optical Society of America.
Bandwidth
Figure 4(a, b) exhibits the temporal waveform and the corresponding spectrum of the same photoacoustic signal. The central frequency of this mechanic mode is ~22 MHz, and the –6 dB bandwidth is ~70%. As described in the previous Section Interaction between ultrasound waves and an optical fiber, the central frequency depends on the elastic properties of the fiberglass and the diameter of the fiber (~125 µm). The bandwidth is determined by the difference in acoustic properties between the fiber and the surrounding water. The working bandwidth can be extended by etching the fiber with hydrofluoric acid. For example, a 65-µm sensor provides a two-fold bandwidth extension, and the central frequency shifts to approximately 40 MHz.
Noise-equivalent pressure
Figure 4(c) shows the measured SNR at different fiber-laser powers with a fixed peak-to-peak acoustic pressure of the incident planar ultrasound wave at 75.2 kPa. The SNR is mainly limited by the noise figure of the photodetector. In the high-input-power regime, the dominant noise source is the shot noise, and the SNR is approximately proportional to the square root of the optical power. Therefore, the incident optical power is amplified with an erbium-doped fiber amplifier to have the photodetector work in the shot noise limited region. Eventually, saturation of the photodetector will limit optical power. When the input power on the photodiode is 30 mW, the NEP is ~43.6 Pa with a 50-MHz acquisition bandwidth31. We found that the ultrasound sensitivity is inversely proportional to the cavity length of the laser sensor. Higher sensitivity can be achieved with shorter lasers. However, the cavity can hardly lase with a length less than 2 mm in a rare-earth doped silica fiber, due to the limited doping concentration.
Stability
Sensor type Material Bandwidth
(MHz)NEP
(mPa·Hz–1/2)Demodulation
methodCommon
applicationPiezoelectric
transducerSpherically focused
(Olympus V214)Piezoceramic 50 MHz 0.2 Voltage PAM Needle (Precision acoustics) PVDF N.R. 14.4 Voltage N.R. Optical ultrasound
sensorsMicro-ring17 Polystyrene 350 5.61 CW interferometry PAM Fabry-Pérot PET/Parylene C SU818 20 44.7 CW interferometry PACT Epoxy12 2.8 1.6 CW interferometry PAM π-FBG Silica15 16 25 CW interferometry PAM Present sensor Silica 18 10.6 Beat signal PAM/PACT N.R.: not reported. Figure 4(d) shows the stability test result of the sensor by measuring the photoacoustic signals from two discrete absorbers excited by using a linearly scanning pulsed laser. The 30-min measurement results show no noticeable variation in the sensitivity. We also observed that even with vibration or temperature changes, the sensor remains stable with high sensitivity. We even scanned the fiber sensor back and forth with a maximum velocity of 10 mm/s with respect to an ultrasound source and found that the sensor can still maintain a stable output. The good stability is also a result of the common noise cancelation, taking advantage of the beat-note based demodulation. The acoustically induced lasing frequency change can also be demodulated based on imbalanced interferometry, but a servo loop for frequency locking is needed.
The performances of the present sensor are compared with the piezoelectric and optical ultrasound sensors in Table 1. This sensor has comparable sensitivities to the existing optical sensors. In addition, the sensor has presented a great flexibility in sensor geometry, making it suitable for both photoacoustic microscopy and computed tomography. Notably, new microlasers have been recently developed with biocompatible materials and can even be implemented into human cells32. This may open up new possibilities for noncontact detection of pressure and acoustic waves in the biological tissues, by using the laser sensing technology.
Photoacoustic microscopy (PAM)
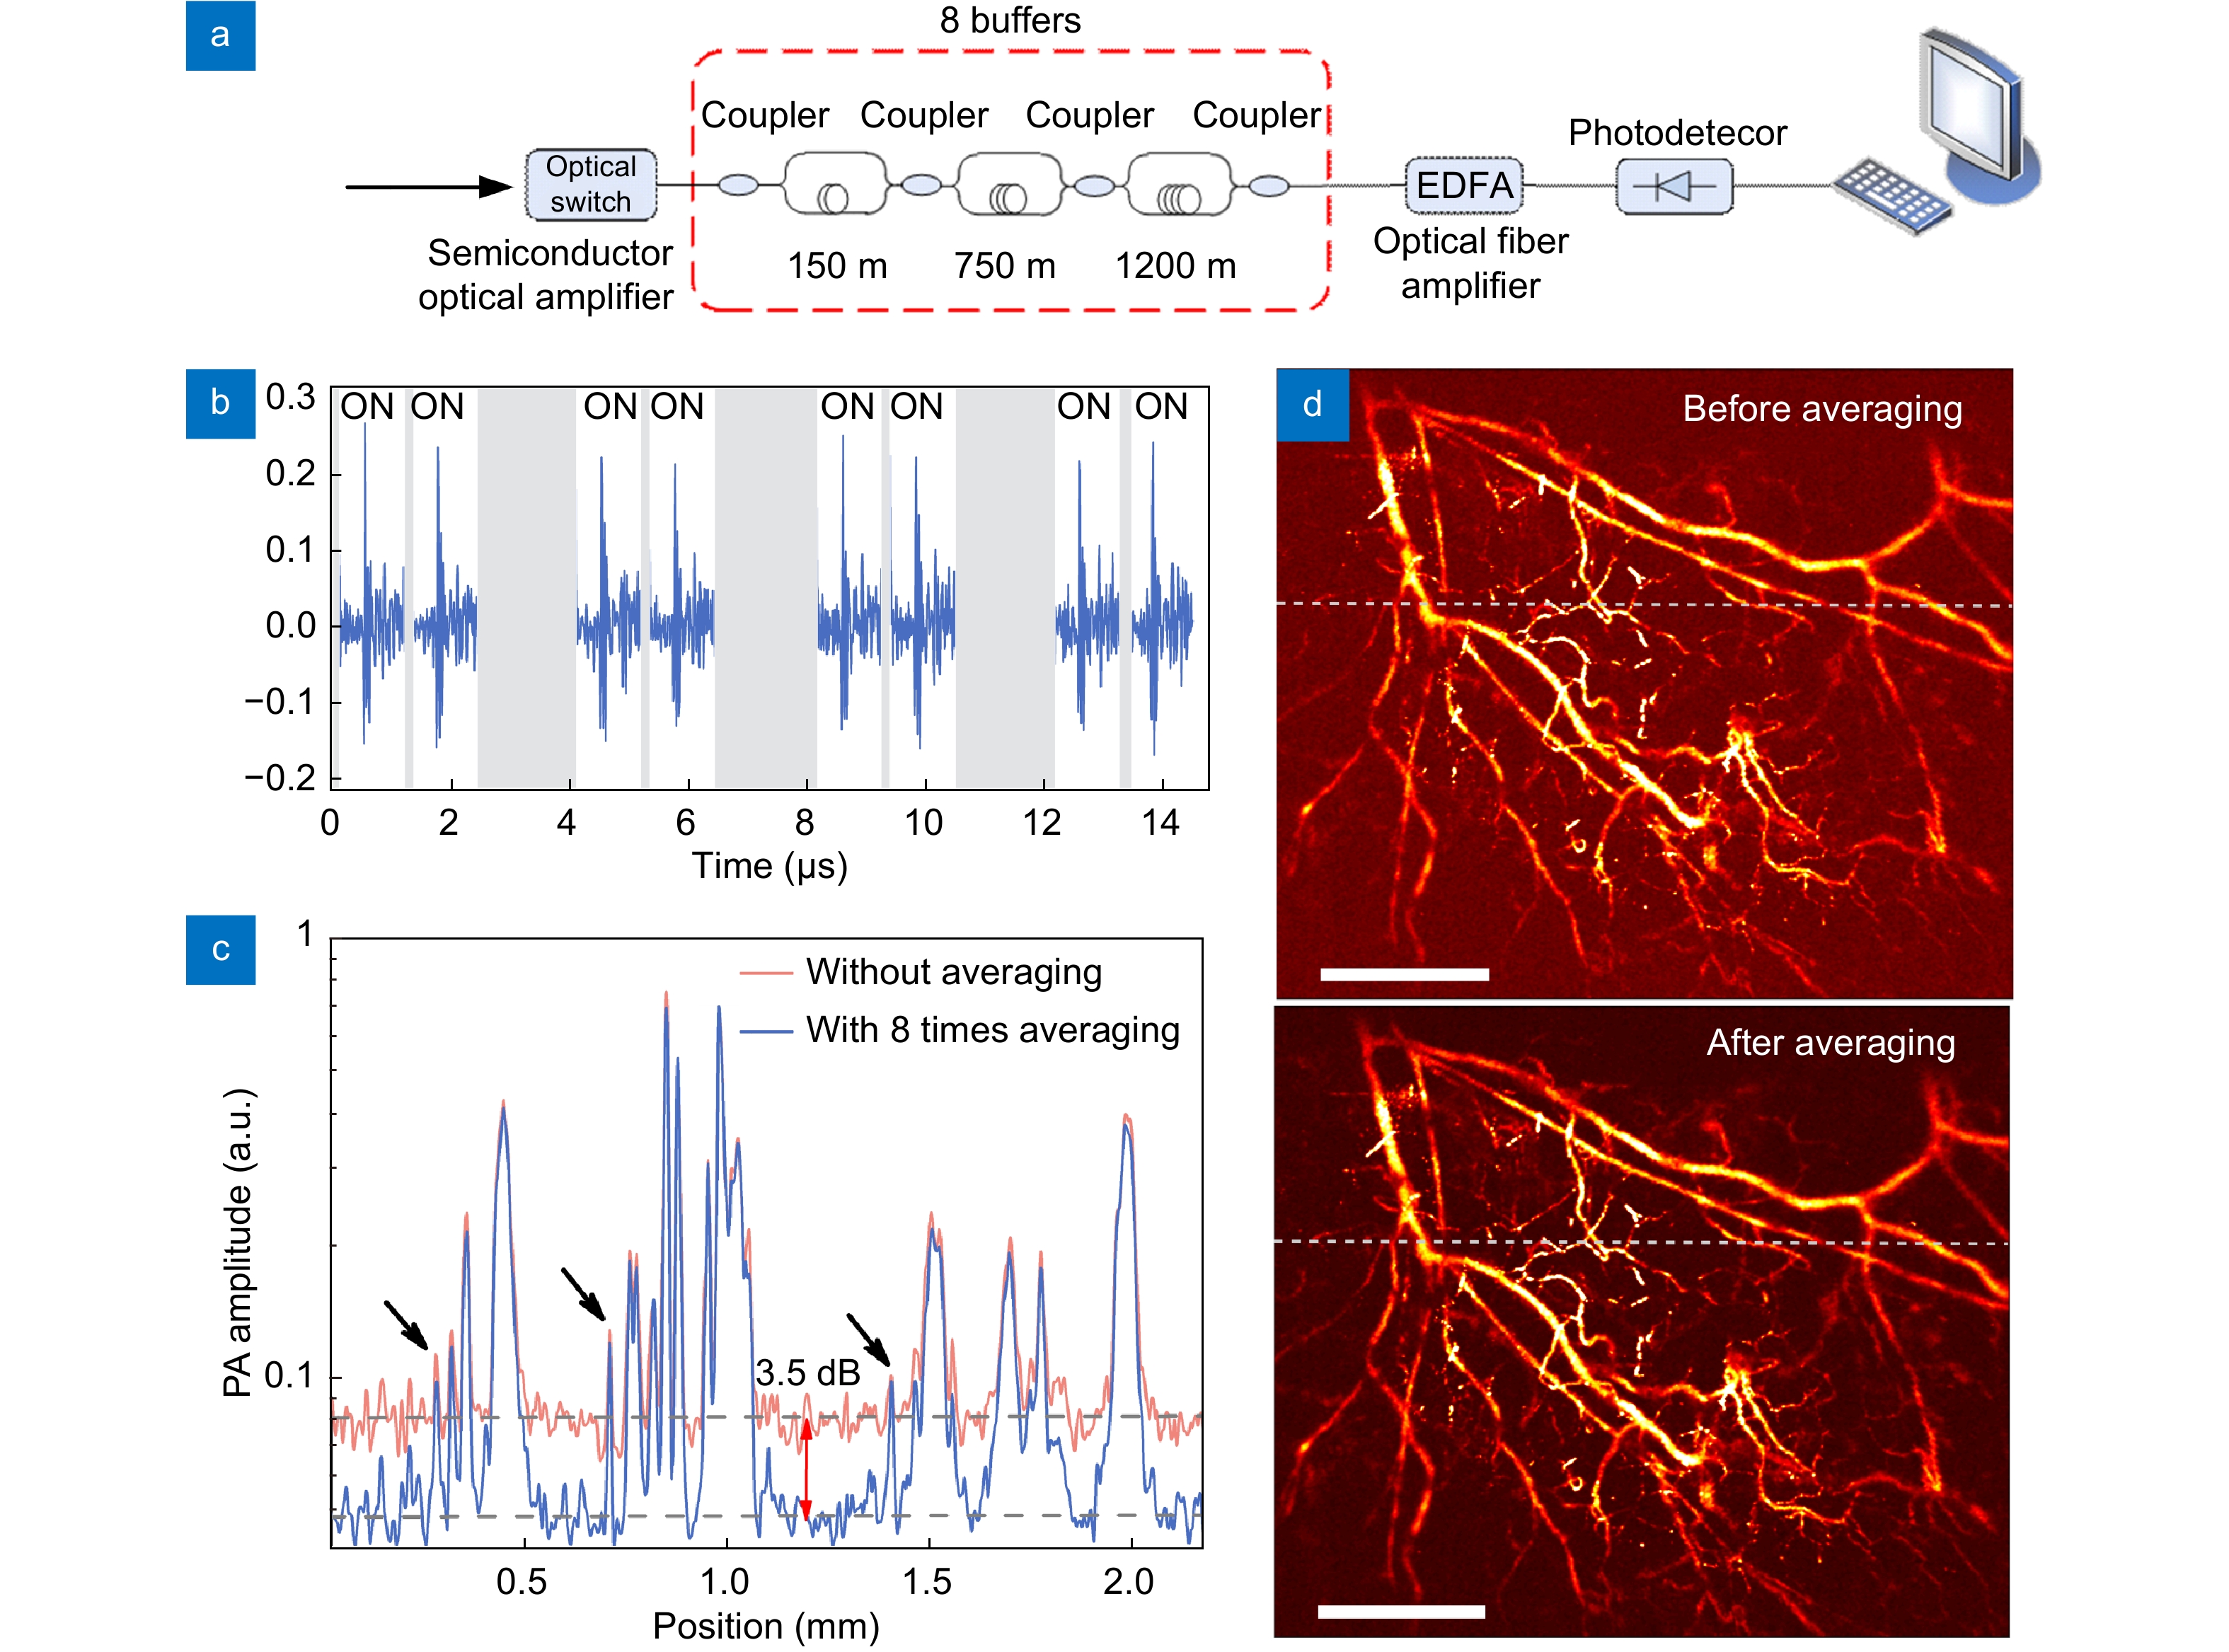
By controlling the time delay of the ultrasonically modulated laser light, a photoacoustic signal can be measured multiple times to enhance the signal-to-noise ratio35. The schematic of signal averaging is shown in Fig. 6(a). The laser light that carries the ultrasound modulation is chopped to remain a time window by using an optical switch and then delayed by three-staged cascaded differential delay lines to be duplicated into 8 copies. Each copy is optically amplified and sequentially measured with one photodetector, as shown in Fig. 6(b). Each measurement consists of independent random noises from the detection systems. After averaging the digitized signals, the noise from the detection system is reduced by 64%, and the total noise is suppressed by 40%. Figure 6(c) shows a background noise reduction of 3.5 dB with optical-resolution PAM with signal-averaging treatment. Figure 6(d) shows the results before and after performing the averaging method. The vessels and capillaries are more clearly resolved as a result of SNR enhancement. Such signal duplication and delay can hardly be performed with piezoelectric transducers but can be conveniently performed with an optical fiber link with a minimal loss in SNR.
![Figure 6. (a) The optical signal duplication system. The ultrasonically modulated laser light is duplicated into 8 copies. (b) Demodulated ultrasound signals of the 8 copies. (c) B-scan signals before and after signal averaging, showing a 3.5 dB reduction in the background noise. (d) In vivo PAM results before and after signal averaging. The visibility has been effectively enhanced by the signal averaging method. Figure reproduced with permission from ref.35, Optical Society of America.]()
(a) The optical signal duplication system. The ultrasonically modulated laser light is duplicated into 8 copies. (b) Demodulated ultrasound signals of the 8 copies. (c) B-scan signals before and after signal averaging, showing a 3.5 dB reduction in the background noise. (d) In vivo PAM results before and after signal averaging. The visibility has been effectively enhanced by the signal averaging method. Figure reproduced with permission from ref.35, Optical Society of America.
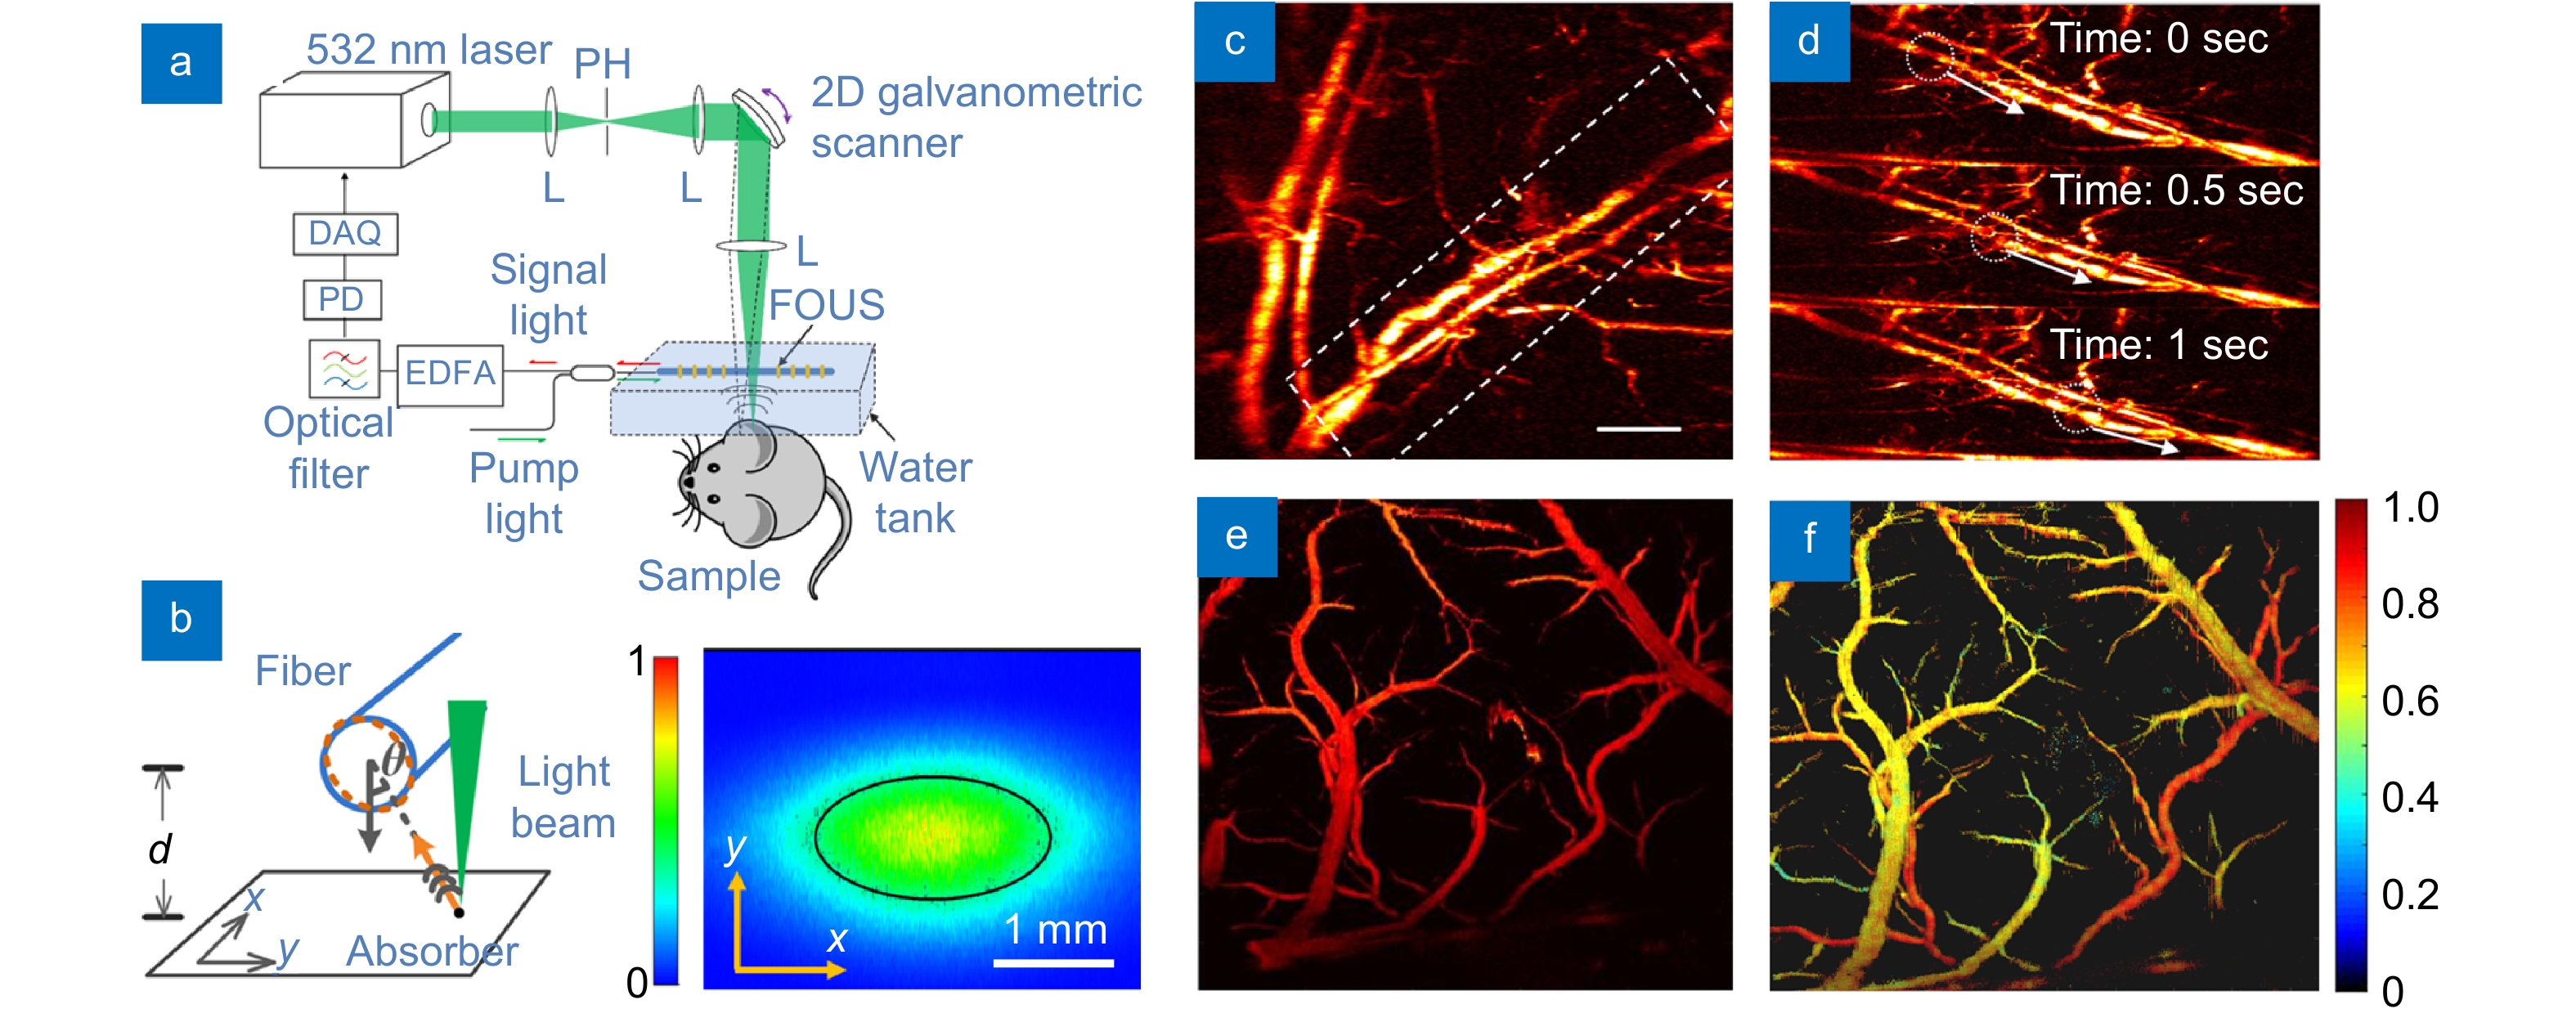
Photoacoustic microscopy (PAM) focuses a pulsed laser beam on biological tissue and detects ultrasound waves by using a coaligned focused piezoelectric transducer. The scanning head raster scans over the plane orthogonal to the laser incidence direction to form a two-dimensional image. Additionally, the depths of the absorbers can be retrieved at acoustic resolution based on time-to-space mapping, forming a three-dimensional image. Despite its high spatial resolution and structural/functional imaging capability, PAM is limited by the mechanical scanning speed of the apparatus. A fast-scanning PAM apparatus can be built by using a straight fiber-laser-based ultrasound sensor, taking advantage of its high sensitivity and large field-of-view (FOV). This section reviews fiber-based PAM for in vivo structural and functional imaging at a cellular resolution. Figure 5(a) shows the schematic of the PAM apparatus. Here, the fiber sensor remains stationary, while the optical beam is scanned by using a galvanometric scanner in air to achieve a high speed. A pulsed laser beam is focused on the absorptive sample with an optical-diffraction-limited spot size. The FOV is first characterized before in vivo imaging. Figure 5(b) shows the measured field of view at d=1 mm between the laser fiber sensor and a point-like photoacoustic source. The source is raster scanned with respect to the laser fiber sensor in the x-y plane. The sensitivity profile along the fiber direction is ~2 mm, determined by the longitudinal intensity profile of the intracavity light. The sensitivity profile normal to the fiber direction, in contrast, depends on the radial orientation of the fiber laser sensor in proportion to cos(2θ), where θ represents the orientation angle with respect to one of the fiber principal axes. The ultrasonic response reaches its maximum in the fiber principle axis directions. The full angle at half maximum is 60 degrees. As a result, the effective field of view normal to the fiber direction scales with distance d. The field of view (FOV) presents an effective area (at half maximum) of 1.57 mm2 at d=1 mm with a nearly elliptical profile.
where PA532 and PA558 represent the photoacoustic amplitudes excited by the dual-color laser pulses. The elements in the 2-by-2 matrix denote the molar absorption coefficients, showing the difference in the absorption spectrum between HbR and HbO2. The sO2 value at each pixel can be derived with the measured photoacoustic amplitudes and the given coefficient matrix. Figure 5(e) shows the cortex blood vessels obtained with a single wavelength laser. In contrast, an sO2 image can be obtained by performing spectral unmixing based on Eq. (4) at each position, as shown in Fig. 5(f). The oxygen saturation levels are represented in different colors, and we are capable of distinguishing the pile surface arteries (red) and veins (yellow).
Figure 5(c) shows the result of hemodynamic imaging, with a scanning rate increased to 2 Hz and a FOV of 2×2 mm2 31. In the experiment, the laser has a typical pulse energy of ~300 nJ, repetition rate of 160 kHz, and pulse width of ~1.8 ns. The B-scan rate is 400 Hz. Each volumetric image has 200×200 A-lines. The step size in the lateral direction is 10 µm. The high imaging speed enables recording blood flow in both trunk vessels and capillaries. The highest measurable flow speed is 4 mm/s in the transverse plane. Figure 5(d) shows three consecutive snapshots with a time interval of 0.5 seconds. We can see a negative contrast feature flowing in the blood vessel. Based on this imaging capability, the flow velocities in the individual vessels and capillaries can be quantified.
Imaging of oxygen saturation (sO2) can provide invaluable information on the functionality and metabolism of living tissues. An sO2 map describes the processes of oxygen transport and consumption in biological tissues, based on which the functionality of the cardiovascular system can be evaluated. Brain functional imaging can be performed with the fiber-laser-based PAM apparatus paired with a multiwavelength laser source. A dual- or multiwavelength source can be built based on stimulated Raman scattering (SBS). Briefly, a nanosecond 532-nm laser is split into two beams, one of which is injected into a high-nonlinearity fiber to generate a 558-nm component via SBS (as the second-order Stokes wave). The other beam transmits through a large-mode-area fiber for time delay without wavelength transition. These two beams are then coupled back into a common fiber and focused on the biological tissue to generate pulse trains with a controllable time interval. The optical absorption of blood at the visible band comes from the mixture of HbR and HbO2, whose concentrations are denoted as CHbR and CHbO2, respectively. The oxygen saturation is defined as the ratio between them, expressed as sO2=CHbO2/(CHbO2+CHbR). Assuming that the amplitude of the photoacoustic signal is proportional to the absorption coefficient, we can write33, 34
[k532CHbO2k532CHbRk558CHbO2k558CHbO2][CHbO2CHbR]=[PA532PA558], ![Figure 5. (a) Schematic of a fiber-based PAM apparatus. (b) Schematic (left) and result (right) of the field-of-view measurement. (c) PAM result of a mouse ear that contains branches of blood vessels and capillaries. (d) Three consecutive snapshots showing the blood flow in the mouse ear. (e) Hemoglobin concentration image of a mouse brain obtained with a 532 nm pulse laser. (f) Oxygen saturation images enabled by a dual-wavelength laser source33, 34.]()
(a) Schematic of a fiber-based PAM apparatus. (b) Schematic (left) and result (right) of the field-of-view measurement. (c) PAM result of a mouse ear that contains branches of blood vessels and capillaries. (d) Three consecutive snapshots showing the blood flow in the mouse ear. (e) Hemoglobin concentration image of a mouse brain obtained with a 532 nm pulse laser. (f) Oxygen saturation images enabled by a dual-wavelength laser source33, 34.
Photoacoustic computed tomography (PACT)
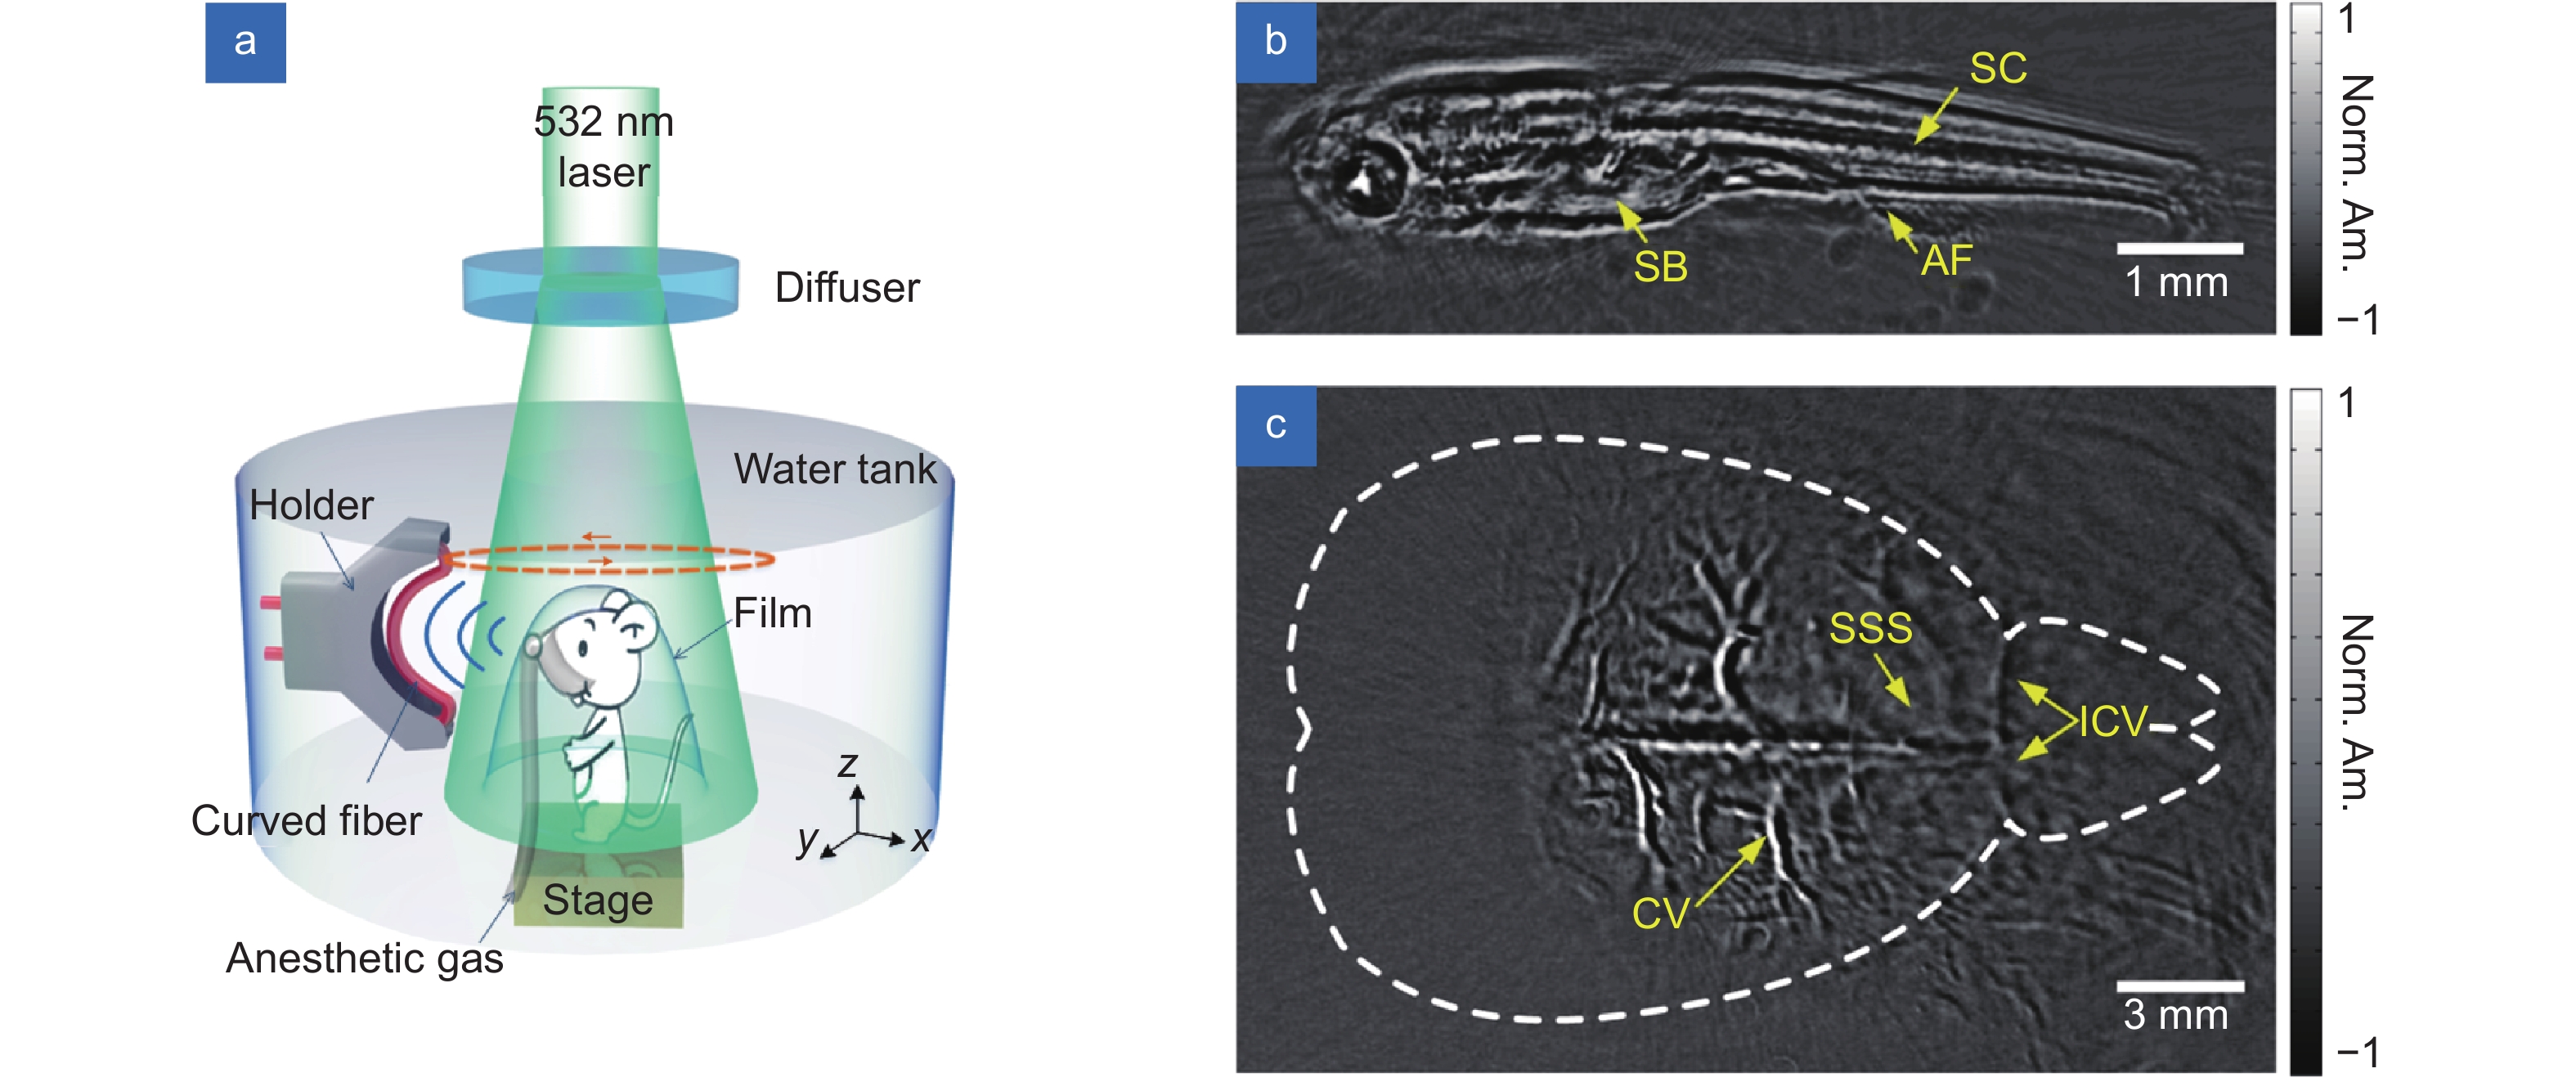
The imaging was performed in a rotary-scanning manner, as shown in Fig. 7(a)29. A curved sensor with a curvature radius of 30 mm was scanned with a rotary motor with an angular step of 0.36 degrees. The laser pulses were uniformly dispersed and projected on the biological tissue. The width of the FOV was estimated to be 7.7 mm, and the in-plane spatial resolution was approximately 70 μm. Figure 7(b) shows the imaging result of a 25-day-postfertilization zebrafish, which clearly shows features such as internal organ boundaries. Figure 7(c) shows the 2D photoacoustic image of the brain of an anesthetized mouse. The mouse was shaved and held beneath the water tank, as shown in Fig. 7(a). Ultrasound gel was applied between the intact scalp and the covered plastic film. The main blood vessels in the cortex were clearly resolved. In contrast to traditional PZTs, the proposed focused fiber ultrasound sensor is lens-free, optical transparent and focus-tunable, making it promising for PA imaging in biological/medical studies as well as clinical applications.
The straight sensor showed great potential for in vivo OR-PAM imaging of vasculature in mouse ears. As the sensor sensitivity decayed with increasing working distance, the mouse ear needed to be placed close to the fiber surface during the imaging process. This phenomenon results from the wavelength-scale equivalent interaction length of a straight fiber for spherical ultrasound waves and limits the potential for deep tissue imaging. This issue was addressed by bending the fiber to realize lens-free focused ultrasound sensor with greatly increased sensitivity at long working distance. The focus capability was obtained by simply bending the straight FUS along its axial direction to conform the spherical wavefront of ultrasound. At a curvature radius of 30 mm, the focused FUS showed a ~5 times higher sensitivity compared with the straight one, and was demonstrated for in vivo PACT imaging of a zebrafish and a mouse brain, as shown in Fig. 7.
![Figure 7. (a) Schematic of a rotary-scanning PACT with the fiber laser sensor. Photoacoustic images of (b) a zebrafish and (c) a mouse brain. SB: swim bladder; SC: spinal cord; AF: anal fin; CV: cortical vessels; SSS: superior sagittal sinus; ICV: inferior cerebral vein. Figure reproduced with permission from ref.29, Optical Society of America.]()
(a) Schematic of a rotary-scanning PACT with the fiber laser sensor. Photoacoustic images of (b) a zebrafish and (c) a mouse brain. SB: swim bladder; SC: spinal cord; AF: anal fin; CV: cortical vessels; SSS: superior sagittal sinus; ICV: inferior cerebral vein. Figure reproduced with permission from ref.29, Optical Society of America.
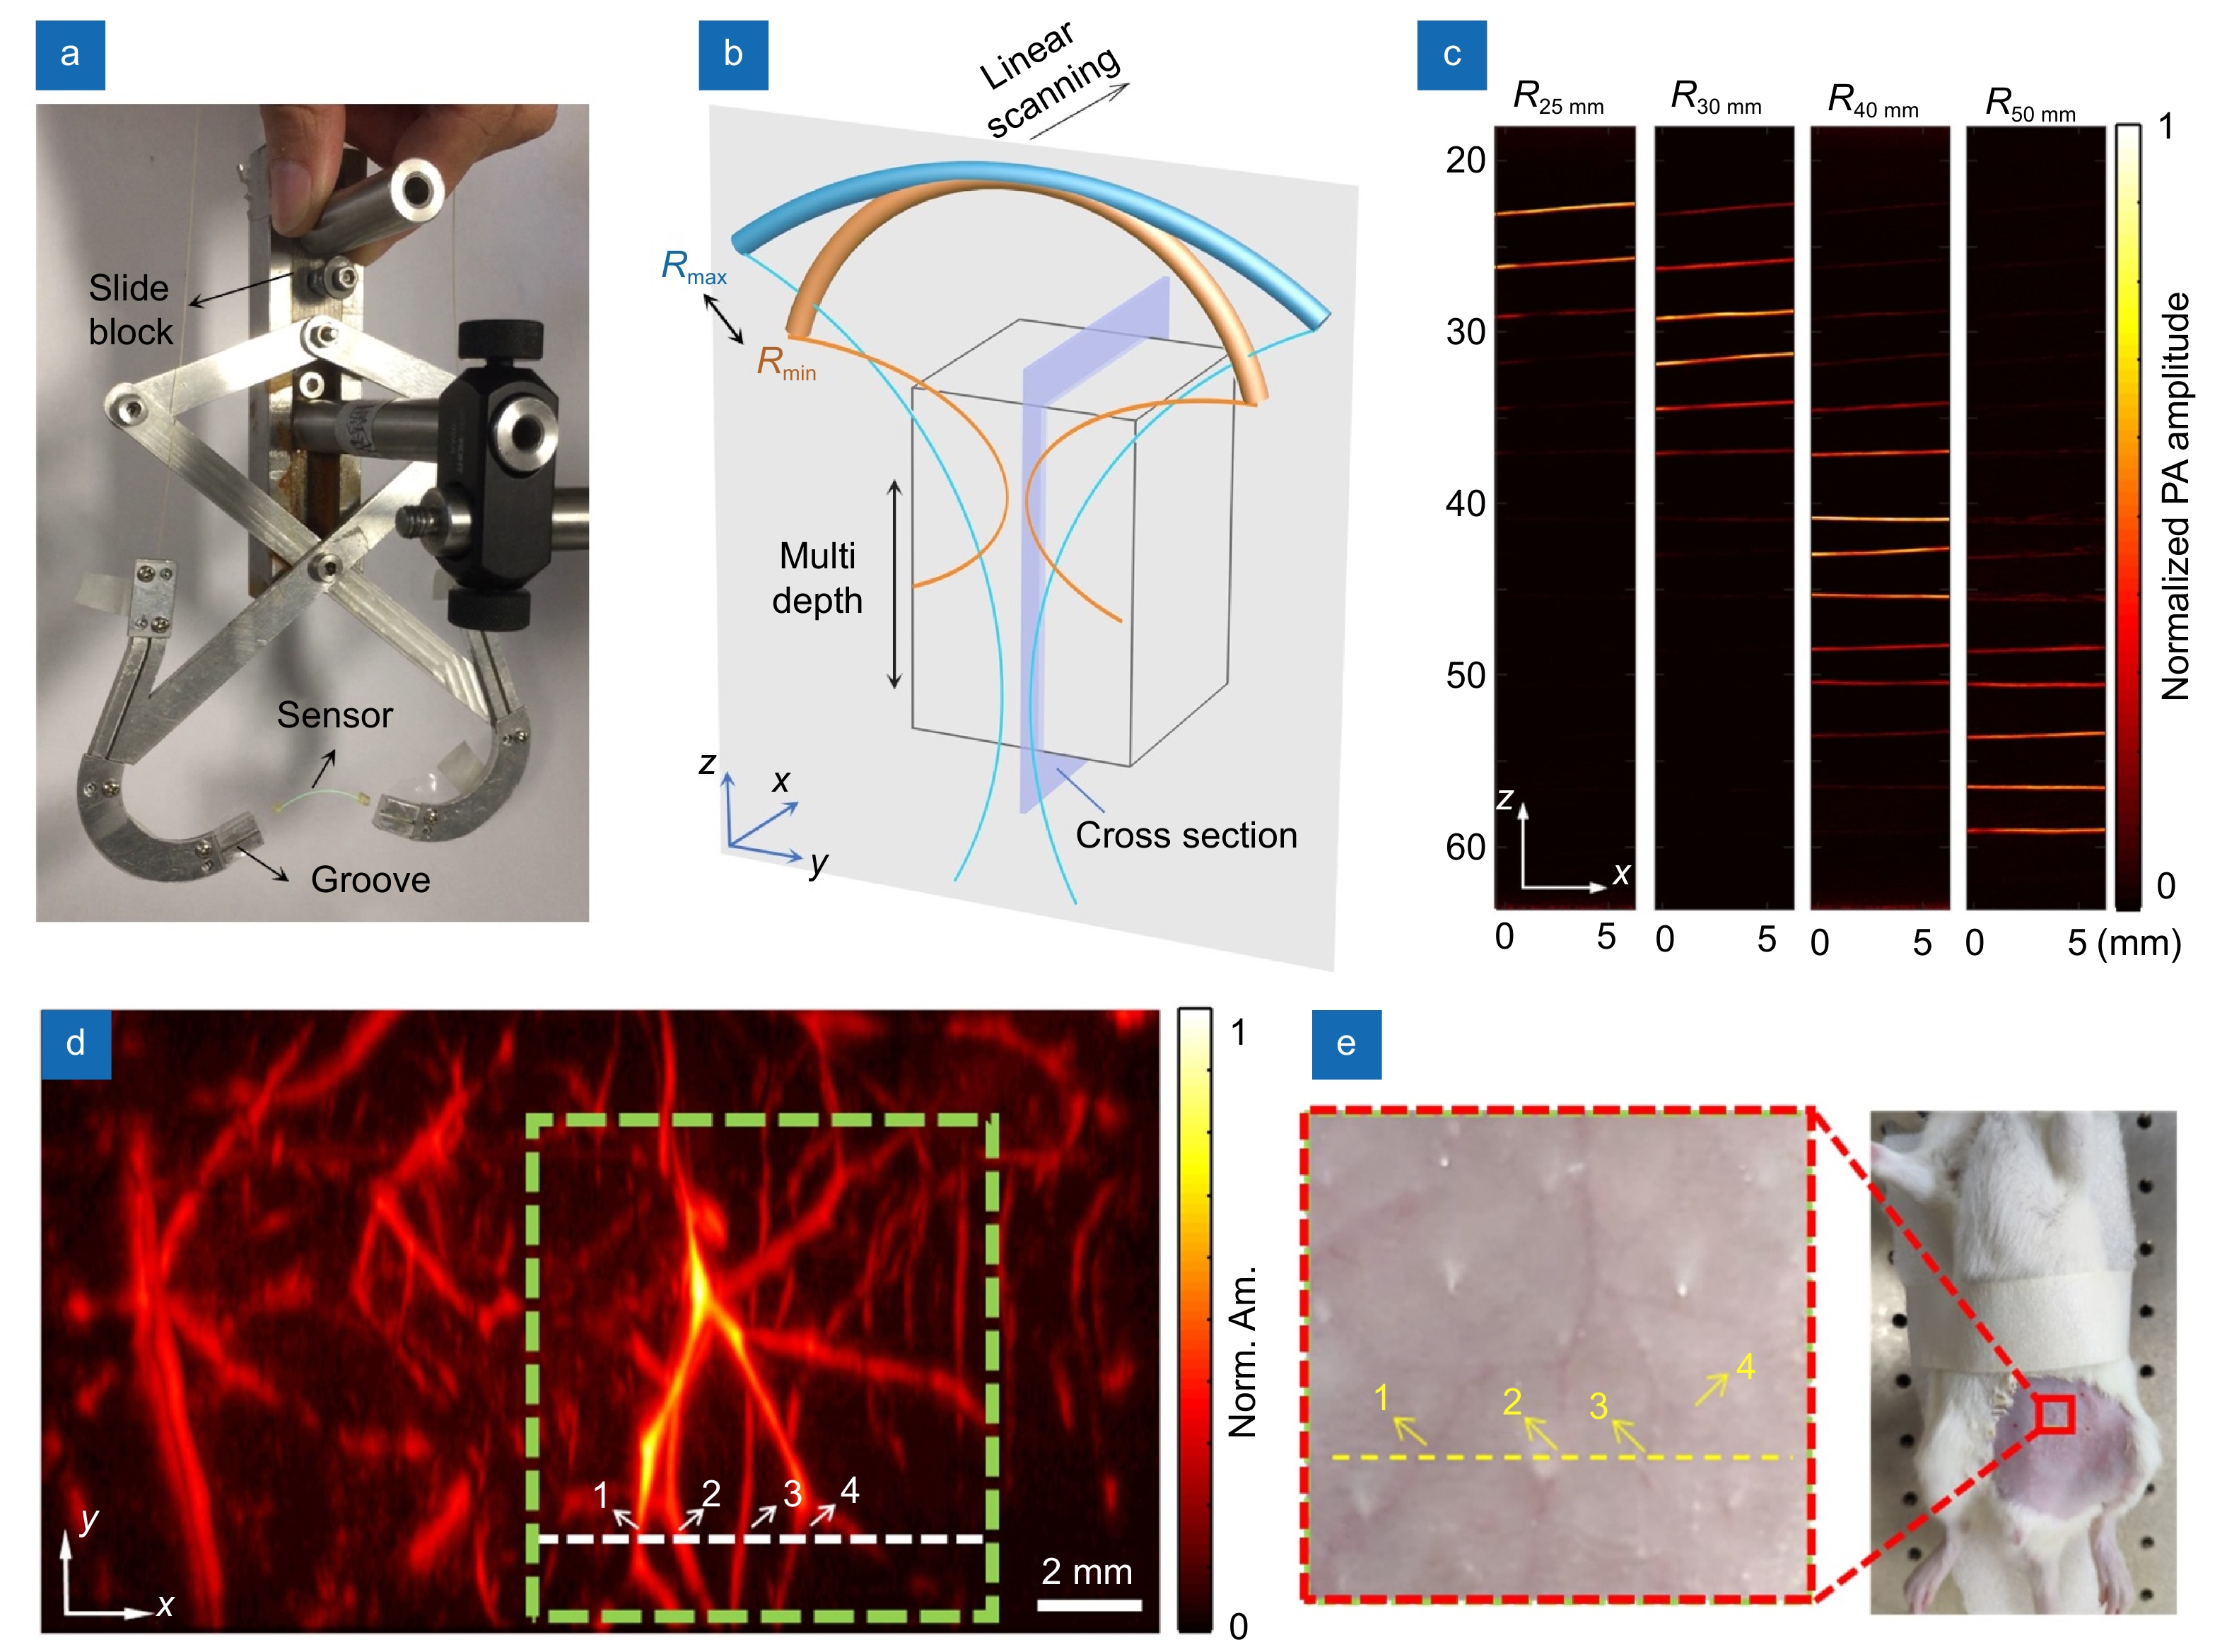
By designing a focus-tuning holder, we further exploits the flexibility of optical fiber to dynamically tune the focus of the sensor by bending the fiber into different curvature radii for multi-depth imaging. The small diameter of the fiber laser also provides a wide acceptance angle and the focusing capability in elevational direction for high-resolution cross section imaging, making the focused fiber laser an ideal candidate for developing a high-resolution linear-scanning PACT system, which allows easy access to patient body trunks and high compatibility with handheld ultrasound probes for preclinical and clinical applications. Figure 8(a) shows the photograph of the customized holder, which can continuously tune the focal depth of the sensor from 22 to 50 mm by simply moving the slide block. Bending the fiber can induce a shift in the carrier frequency of the fiber sensor, but the signal-to-noise ratio is hardly changed. To realize a 2D PACT, the curved fiber laser is kept in the y-z plane, and the holder is scanned by using a motor-driven translation stage in the x direction, as shown in Fig. 8(b). The biological sample is illuminated by using a 532-nm pulsed laser with an expanded beam aperture. The optically induced ultrasound waves are detected at each scanning position and then reconstructed based on the back-projection algorithm. The multi-depth imaging capability was verified by imaging a group of human hairs parallelly aligned with a spacing of 3 mm along the z axis in a block of agar, as shown in Fig. 8(c). The capability of high-resolution small-animal PACT was studied by imaging the abdominal subcutaneous vasculature of a rat (Sprague-Dawley; weight: 150 g) anesthetized with 1.5% isoflurane. The radiant exposure was 3 mJ/cm2, much lower than the ANSI limit. Figure 8(d) shows the maximum amplitude projection image of rat vasculature in a 12 mm×20 mm area, in accordance with the photograph in Fig. 8(e). The in-plane spatial resolution was characterized as 150 μm×80 μm, determined by the bandwidth and the angle-of-view of the fiber laser sensor. The high resolution of the system allows clear observation of vessels with diameters varying from 90 to 400 μm. It is worth to note that the current radiant exposure is ~ 7 times lower than the ANSI limit. A high-power pulsed laser at near infrared wavelength could be employed for high-contrast, high-penetration 3D in vivo imaging in the future.
![Figure 8. (a) Photograph of the holder for adjusting the bending curvature of the sensor. (b) Schematic of the multidepth PACT. (c) Photoacoustic images of human hairs at different depths in the x-z plane. (d) In vivo photoacoustic image of the abdominal subcutaneous vasculature of a rat. (e) Photograph of the rat with the fur removed before imaging. The red dashed box in (e) corresponds to the green box in (d). The yellow dashed line in (e) corresponds to the white dashed line in (d). Figure reproduced with permission from ref.36, AIP Publishing.]()
(a) Photograph of the holder for adjusting the bending curvature of the sensor. (b) Schematic of the multidepth PACT. (c) Photoacoustic images of human hairs at different depths in the x-z plane. (d) In vivo photoacoustic image of the abdominal subcutaneous vasculature of a rat. (e) Photograph of the rat with the fur removed before imaging. The red dashed box in (e) corresponds to the green box in (d). The yellow dashed line in (e) corresponds to the white dashed line in (d). Figure reproduced with permission from ref.36, AIP Publishing.
Conclusion and outlook
In conclusion, we have developed an ultrasound sensing technology based on a flexible FUS. The ultrasound pressure is detected by reading out the beat frequency at radio frequencies. The sensor presents outstanding performance in sensitivity, bandwidth and stability. More importantly, the spatial ultrasound response can be freely tuned by simply bending the fiber enabling multiscale PAI with a single fiber laser sensor. Based on this unique flexibility of the sensor, multiscale photoacoustic imaging including micro-scale resolution PAM and deep-tissue PACT have been demonstrated for in vivo small animals imaging. The in vivo imaging results suggest that the fiber-laser based photoacoustic imaging is promising to the development of various modalities including PA microscopy, endoscopy and tomography for both life science research and medical diagnostics. The potential future developments and applications of fiber-based photoacoustic imaging technology are provided as following:
Secondly, an all-fiber photoacoustic endoscopy can be achieved with the sensor, equipped with another fiber for the guidance of excitation light pulses. The development of photoacoustic endoscopy is currently limited by the tradeoff between device size and imaging performance, such as sensitivity and spatial resolution. The fiber laser sensor inherently offers a side-view detection with high sensitivity, making it suitable for the miniaturization of endoscopy.
Firstly, the fiber laser sensor may enable miniature head-mounted microscopy for brain activity monitoring. Two- or multiphoton microscopes have been developed with an all-fiber configuration. These microscopes can resolve single neurons in response to a stimulus. However, the field of view is rather limited. Small PAM apparatus has been created with a small piezoelectric transducer, but the weight is typically above 20 grams, which is hardly bearable for small animals. Fiber-laser-based PAM can offer a possible strategy of using a lightweight head-mounted microscope to monitor brain activities based on neurovascular couplings.
Finally, flexible PACT can be integrated to hand-held scanners for the cancer screening in preclinical/clinical applications. To increase the imaging speed of our previously reported FUS-based PACT, a fiber laser sensor array with multiple parallel elements can be built considering the intrinsic wavelength multiplexing capability of optical fibers. Specifically for the FUS, frequency and time multiplexing techniques are preferred to form a large-scale sensor array with a single RF demodulation unit. Such a system would not only speed up the imaging process but also significantly reduce the cost for preclinical/clinical applications.
Acknowledgements
This work was supported by the National Natural Science Foundation of China (61775083, 61705082, 61805102, and 61860206002), the Local Innovative and Research Teams Project of Guangdong Pearl River Talents Program (2019BT02X105), and Guangzhou Science and Technology Plan (201904020032).
Competing interests
The authors declare no competing financial interests.
-
References
[1] Niendorf T, Frydman L, Neeman M, Seeliger E. Google maps for tissues: multiscale imaging of biological systems and disease. Acta Physiol 228, e13392 (2020).
[2] Wang LV. Multiscale photoacoustic microscopy and computed tomography. Nat Photonics 3, 503–509 (2009).
DOI: 10.1038/nphoton.2009.157[3] Yao YJ, Kaberniuk AA, Li L, Shcherbakova DM, Zhang RY et al. Multiscale photoacoustic tomography using reversibly switchable bacterial phytochrome as a near-infrared photochromic probe. Nat Methods 13, 67–73 (2016).
DOI: 10.1038/nmeth.3656[4] Taruttis A, Ntziachristos V. Advances in real-time multispectral optoacoustic imaging and its applications. Nat Photonics 9, 219–227 (2015).
DOI: 10.1038/nphoton.2015.29[5] Yao JJ, Wang LV. Photoacoustic microscopy. Laser Photonics Rev 7, 758–778 (2013).
DOI: 10.1002/lpor.201200060[6] Li L, Zhu LR, Ma C, Lin L, Yao JJ et al. Single-impulse panoramic photoacoustic computed tomography of small-animal whole-body dynamics at high spatiotemporal resolution. Nat Biomed Eng 1, 0071 (2017).
DOI: 10.1038/s41551-017-0071View full references list -
Author Information
-
Copyright
Open Access. © The Author(s). This article is licensed under a Creative Commons Attribution 4.0 International License. To view a copy of this license, visit http://creativecommons.org/licenses/by/4.0/. -
About this Article
Cite this Article
Bai-Ou Guan, Long Jin, Jun Ma, et al. Flexible fiber-laser ultrasound sensor for multiscale photoacoustic imaging. Opto-Electronic Advances 4, 200081 (2021). DOI: 10.29026/oea.2021.200081Download CitationArticle History
- Received Date November 20, 2020
- Accepted Date December 29, 2020
- Available Online August 24, 2021
- Published Date August 24, 2021
Article Metrics
Article Views(9284) PDF Downloads(1853)
 OE Journals Group

Focuses on the advances of the cutting edge innovations of optics, photonics and optoelectronics
JCR Impact Factor: 22.4
CiteScore: 26.8
Open Access