
 E-mail Alert
 RSS
RSS
| Citation: |
Chen S, Lin K, Chen X et al. Spectrally extended line field optical coherence tomography angiography. Opto-Electron Adv 8, 240293 (2025). doi: 10.29026/oea.2025.240293

|
Spectrally extended line field optical coherence tomography angiography
-
Abstract
Optical coherence tomography angiography (OCTA) is a powerful tool for non-invasive, label-free, three-dimensional visualization of blood vessels down to the capillary level in vivo. However, its widespread usage is hindered by the trade-off between transverse sampling rate and signal-to-noise ratio (SNR). This trade-off results in either a limited field of view (FOV) to maintain sampling density or loss of capillary details to fulfil FOV requirement. It also restricts microvascular quantifications, including flow velocimetry, which typically demand higher transverse sampling rate and SNR compared with standard qualitative OCTA. We introduce spectrally extended line field OCTA (SELF-OCTA), a cost-effective imaging modality that improves transverse sampling rate and SNR through spectrally encoded parallel sampling and increased signal acquired over longer periods, respectively. In the human skin and retina in vivo, we demonstrate its advantages in achieving significantly extended FOV without sacrificing microvascular resolution, high sensitivity to slower flow without compromising FOV, and flow velocity quantification with the highest dynamic range, emphasizing that these features can be achieved with readily available and standard OCTA hardware settings. SELF-OCTA has the potential to make wide-field, high-resolution, quantitative angiographic imaging accessible to a wider population, thereby facilitating the early detection and follow-up of vascular-related diseases. -

-
References
[1] Cheung CYL, Ikram MK, Sabanayagam C et al. Retinal microvasculature as a model to study the manifestations of hypertension. Hypertension 60, 1094–1103 (2012). doi: 10.1161/HYPERTENSIONAHA.111.189142 [2] Shi HS, Koronyo Y, Fuchs DT et al. Retinal capillary degeneration and blood-retinal barrier disruption in murine models of Alzheimer’s disease. Acta Neuropathol Commun 8, 202 (2020). doi: 10.1186/s40478-020-01076-4 [3] Kashani AH, Chen CL, Gahm JK et al. Optical coherence tomography angiography: a comprehensive review of current methods and clinical applications. Prog Retin Eye Res 60, 66–100 (2017). doi: 10.1016/j.preteyeres.2017.07.002 [4] Spaide RF, Fujimoto JG, Waheed NK et al. Optical coherence tomography angiography. Prog Retin Eye Res 64, 1–55 (2018). doi: 10.1016/j.preteyeres.2017.11.003 [5] Niederleithner M, de Sisternes L, Stino H et al. Ultra-widefield OCT angiography. IEEE Trans Med Imaging 42, 1009–1020 (2023). doi: 10.1109/TMI.2022.3222638 [6] Sampson DM, Dubis AM, Chen FK et al. Towards standardizing retinal optical coherence tomography angiography: a review. Light Sci Appl 11, 63 (2022). doi: 10.1038/s41377-022-00740-9 [7] Borrelli E, Sarraf D, Freund KB et al. OCT angiography and evaluation of the choroid and choroidal vascular disorders. Prog Retin Eye Res 67, 30–55 (2018). doi: 10.1016/j.preteyeres.2018.07.002 [8] Vakoc BJ, Lanning RM, Tyrrell JA et al. Three-dimensional microscopy of the tumor microenvironment in vivo using optical frequency domain imaging. Nat Med 15, 1219–1223 (2009). doi: 10.1038/nm.1971 [9] Liang KC, Wang Z, Ahsen OO et al. Cycloid scanning for wide field optical coherence tomography endomicroscopy and angiography in vivo. Optica 5, 36–43 (2018). doi: 10.1364/OPTICA.5.000036 [10] Gao SS, Jia YL, Zhang M et al. Optical coherence tomography angiography. Invest Ophthalmol Vis Sci 57, OCT27–OCT36 (2016). doi: 10.1167/iovs.15-19043 [11] Ho J, Dans K, You Q S et al. Comparison of 3 mm × 3 mm versus 6 mm × 6 mm optical coherence tomography angiography scan sizes in the evaluation of non-proliferative diabetic retinopathy. Retina 39, 259–264 (2019). doi: 10.1097/IAE.0000000000001951 [12] Choi W, Moult EM, Waheed NK et al. Ultrahigh-speed, swept-source optical coherence tomography angiography in nonexudative age-related macular degeneration with geographic atrophy. Ophthalmology 122, 2532–2544 (2015). doi: 10.1016/j.ophtha.2015.08.029 [13] Ploner SB, Moult EM, Choi W et al. Toward quantitative optical coherence tomography angiography: visualizing blood flow speeds in ocular pathology using variable interscan time analysis. Retina 36, S118–S126 (2016). doi: 10.1097/IAE.0000000000001328 [14] Braaf B, Gräfe MGO, Uribe-Patarroyo N et al. OCT-based velocimetry for blood flow quantification. In Bille JF. High Resolution Imaging in Microscopy and Ophthalmology: New Frontiers in Biomedical Optics 161–179 (Springer, Cham, 2019). [15] Tokayer J, Jia YL, Dhalla AH et al. Blood flow velocity quantification using split-spectrum amplitude-decorrelation angiography with optical coherence tomography. Biomed Opt Express 4, 1909–1924 (2013). doi: 10.1364/BOE.4.001909 [16] Su JP, Chandwani R, Gao SS et al. Calibration of optical coherence tomography angiography with a microfluidic chip. J Biomed Opt 21, 086015 (2016). [17] Choi WJ, Qin W, Chen CL et al. Characterizing relationship between optical microangiography signals and capillary flow using microfluidic channels. Biomed Opt Express 7, 2709–2728 (2016). doi: 10.1364/BOE.7.002709 [18] Uribe-Patarroyo N, Bouma BE. Velocity gradients in spatially resolved laser Doppler flowmetry and dynamic light scattering with confocal and coherence gating. Phys Rev E 94, 022604 (2016). doi: 10.1103/PhysRevE.94.022604 [19] Uribe-Patarroyo N, Villiger M, Bouma BE. Quantitative technique for robust and noise-tolerant speed measurements based on speckle decorrelation in optical coherence tomography. Opt Express 22, 24411–24429 (2014). doi: 10.1364/OE.22.024411 [20] Gräfe MGO, Nadiarnykh O, De Boer JF. Optical coherence tomography velocimetry based on decorrelation estimation of phasor pair ratios (DEPPAIR). Biomed Opt Express 10, 5470–5485 (2019). doi: 10.1364/BOE.10.005470 [21] Lee J, Wu WC, Jiang JY et al. Dynamic light scattering optical coherence tomography. Opt Express 20, 22262–22277 (2012). doi: 10.1364/OE.20.022262 [22] Durduran T, Choe R, Baker WB et al. Diffuse optics for tissue monitoring and tomography. Rep Prog Phys 73, 076701 (2010). doi: 10.1088/0034-4885/73/7/076701 [23] Wei X, Hormel TT, Pi SH et al. High dynamic range optical coherence tomography angiography (HDR-OCTA). Biomed Opt Express 10, 3560–3571 (2019). doi: 10.1364/BOE.10.003560 [24] Yang JL, Su J, Wang J et al. Hematocrit dependence of flow signal in optical coherence tomography angiography. Biomed Opt Express 8, 776–789 (2017). doi: 10.1364/BOE.8.000776 [25] Braaf B, Vermeer KA, Vienola KV et al. Angiography of the retina and the choroid with phase-resolved OCT using interval-optimized backstitched B-scans. Opt Express 20, 20516–20534 (2012). doi: 10.1364/OE.20.020516 [26] Karamata B, Laubscher M, Leutenegger M et al. Multiple scattering in optical coherence tomography. I. Investigation and modeling. J Opt Soc Am A Opt Image Sci Vis 22, 1369–1379 (2005). doi: 10.1364/JOSAA.22.001369 [27] Kaizu Y, Nakao S, Soda T et al. Longer interscan times in OCT angiography detect slower capillary flow in diabetic retinopathy. Ophthalmol Sci 2, 100181 (2022). doi: 10.1016/j.xops.2022.100181 [28] Liu LB, Gardecki JA, Nadkarni SK et al. Imaging the subcellular structure of human coronary atherosclerosis using micro–optical coherence tomography. Nat Med 17, 1010–1014 (2011). doi: 10.1038/nm.2409 [29] Chen S, Liu XY, Wang NS et al. Visualizing micro-anatomical structures of the posterior cornea with micro-optical coherence tomography. Sci Rep 7, 10752 (2017). doi: 10.1038/s41598-017-11380-0 [30] Yi J, Liu WZ, Chen SY et al. Visible light optical coherence tomography measures retinal oxygen metabolic response to systemic oxygenation. Light Sci Appl 4, e334 (2015). doi: 10.1038/lsa.2015.107 [31] Chen S, Ge X, Liu XY et al. Understanding optical reflectance contrast for real-time characterization of epithelial precursor lesions. Bioeng Transl Med 4, e10137 (2019). doi: 10.1002/btm2.10137 [32] Couturier A, Rey PA, Erginay A et al. Widefield OCT-angiography and fluorescein angiography assessments of nonperfusion in diabetic retinopathy and edema treated with anti-vascular endothelial growth factor. Ophthalmology 126, 1685–1694 (2019). doi: 10.1016/j.ophtha.2019.06.022 [33] Chen AY, Liu L, Wang J et al. Measuring glaucomatous focal perfusion loss in the peripapillary retina using OCT angiography. Ophthalmology 127, 484–491 (2020). doi: 10.1016/j.ophtha.2019.10.041 [34] Cui DY, Liu XY, Zhang J et al. Dual spectrometer system with spectral compounding for 1-μm optical coherence tomography in vivo. Opt Lett 39, 6727–6730 (2014). doi: 10.1364/OL.39.006727 [35] Shreesha RDS, Jensen M, Grüner-Nielsen L et al. Shot-noise limited, supercontinuum-based optical coherence tomography. Light Sci Appl 10, 133 (2021). doi: 10.1038/s41377-021-00574-x [36] Liang KC, Liu XY, Chen S et al. Resolution enhancement and realistic speckle recovery with generative adversarial modeling of micro-optical coherence tomography. Biomed Opt Express 11, 7236–7252 (2020). doi: 10.1364/BOE.402847 [37] Hu JQ et al. RSPSSL: a novel high-fidelity Raman spectral preprocessing scheme to enhance biomedical applications and chemical resolution visualization. Light Sci Appl 13, 52 (2024). doi: 10.1038/s41377-024-01394-5 [38] Ge X, Chen S, Lin K et al. Deblurring, artifact-free optical coherence tomography with deconvolution-random phase modulation. Opto-Electron Sci 3, 230020 (2024). doi: 10.29026/oes.2024.230020 [39] International Electrotechnical Commission. Safety of laser products - Part 1: Equipment classification, requirements, and user’s guide. IEC 60825–1 Edition 1.2 (2001). [40] Schulmeister K, Gilber R, Seiser B et al. Retinal thermal laser damage thresholds for different beam profiles and scanned exposure. Proc SPIE 6844, 68441L (2008). doi: 10.1117/12.768671 [41] ANSI. American National Standard for safe use of lasers (ANSI136. 1). ANSI 136.1–2000 (2000). [42] Yun SH, Tearney GJ, Bouma BE et al. High-speed spectral-domain optical coherence tomography at 1.3 µm wavelength. Opt Express 11, 3598–3604 (2003). doi: 10.1364/OE.11.003598 [43] Leitgeb R, Hitzenberger CK, Fercher AF. Performance of fourier domain vs. time domain optical coherence tomography. Opt Express 11, 889–894 (2003). doi: 10.1364/OE.11.000889 [44] An L, Wang RK. In vivo volumetric imaging of vascular perfusion within human retina and choroids with optical micro-angiography. Opt Express 16, 11438–11452 (2008). doi: 10.1364/OE.16.011438 [45] Wojtkowski M, Srinivasan VJ, Ko TH et al. Ultrahigh-resolution, high-speed, Fourier domain optical coherence tomography and methods for dispersion compensation. Opt Express 12, 2404–2422 (2004). doi: 10.1364/OPEX.12.002404 [46] Vos JJ. A theory of retinal burns. Bull Math Biophys 24, 115–128 (1962). doi: 10.1007/BF02477421 [47] Zuclich JA, Lund DJ, Edsall PR et al. Laser-induced retinal damage threshold as a function of retinal image size. Proc SPIE 3591, 335–343 (1999). doi: 10.1117/12.350594 [48] Beatrice ES, Frisch GD. Retinal laser damage thresholds as a function of image diameter. Arch Environ Health Int J 27, 322–326 (1973). doi: 10.1080/00039896.1973.10666388 [49] ANSI. Z80.36–2021 for Light Hazard Protection for Ophthalmic Instruments. (2021). [50] Jia YL, Tan O, Tokayer J et al. Split-spectrum amplitude-decorrelation angiography with optical coherence tomography. Opt Express 20, 4710–4725 (2012). doi: 10.1364/OE.20.004710 [51] Zhang AQ, Zhang QQ, Chen CL et al. Methods and algorithms for optical coherence tomography-based angiography: a review and comparison. J Biomed Opt 20, 100901 (2015). doi: 10.1117/1.JBO.20.10.100901 [52] An L, Qin J, Wang RK. Ultrahigh sensitive optical microangiography for in vivo imaging of microcirculations within human skin tissue beds. Opt Express 18, 8220–8228 (2010). doi: 10.1364/OE.18.008220 [53] Schmoll T, Bagherinia H, Ren HG. OCTA flow signal enhancement by reducing residual structural signal. Invest Ophthalmol Visual Sci 60, PB048 (2019). [54] Richter D, Fard AM, Straub J et al. Relative retinal flow velocity detection using optical coherence tomography angiography imaging. Biomed Opt Express 11, 6710–6720 (2020). doi: 10.1364/BOE.408481 [55] Chu ZD, Lin J, Gao C et al. Quantitative assessment of the retinal microvasculature using optical coherence tomography angiography. J Biomed Opt 21, 66008 (2016). doi: 10.1117/1.JBO.21.6.066008 -
Supplementary Information
Supplementary information for Spectrally extended line field optical coherence tomography angiography 
-
Access History
Figures(6)
Tables(2)
Article Metrics


Export File
Citation
Chen S, Lin K, Chen X et al. Spectrally extended line field optical coherence tomography angiography. Opto-Electron Adv 8, 240293 (2025). doi: 10.29026/oea.2025.240293
Format
Content
 DownLoad:
-
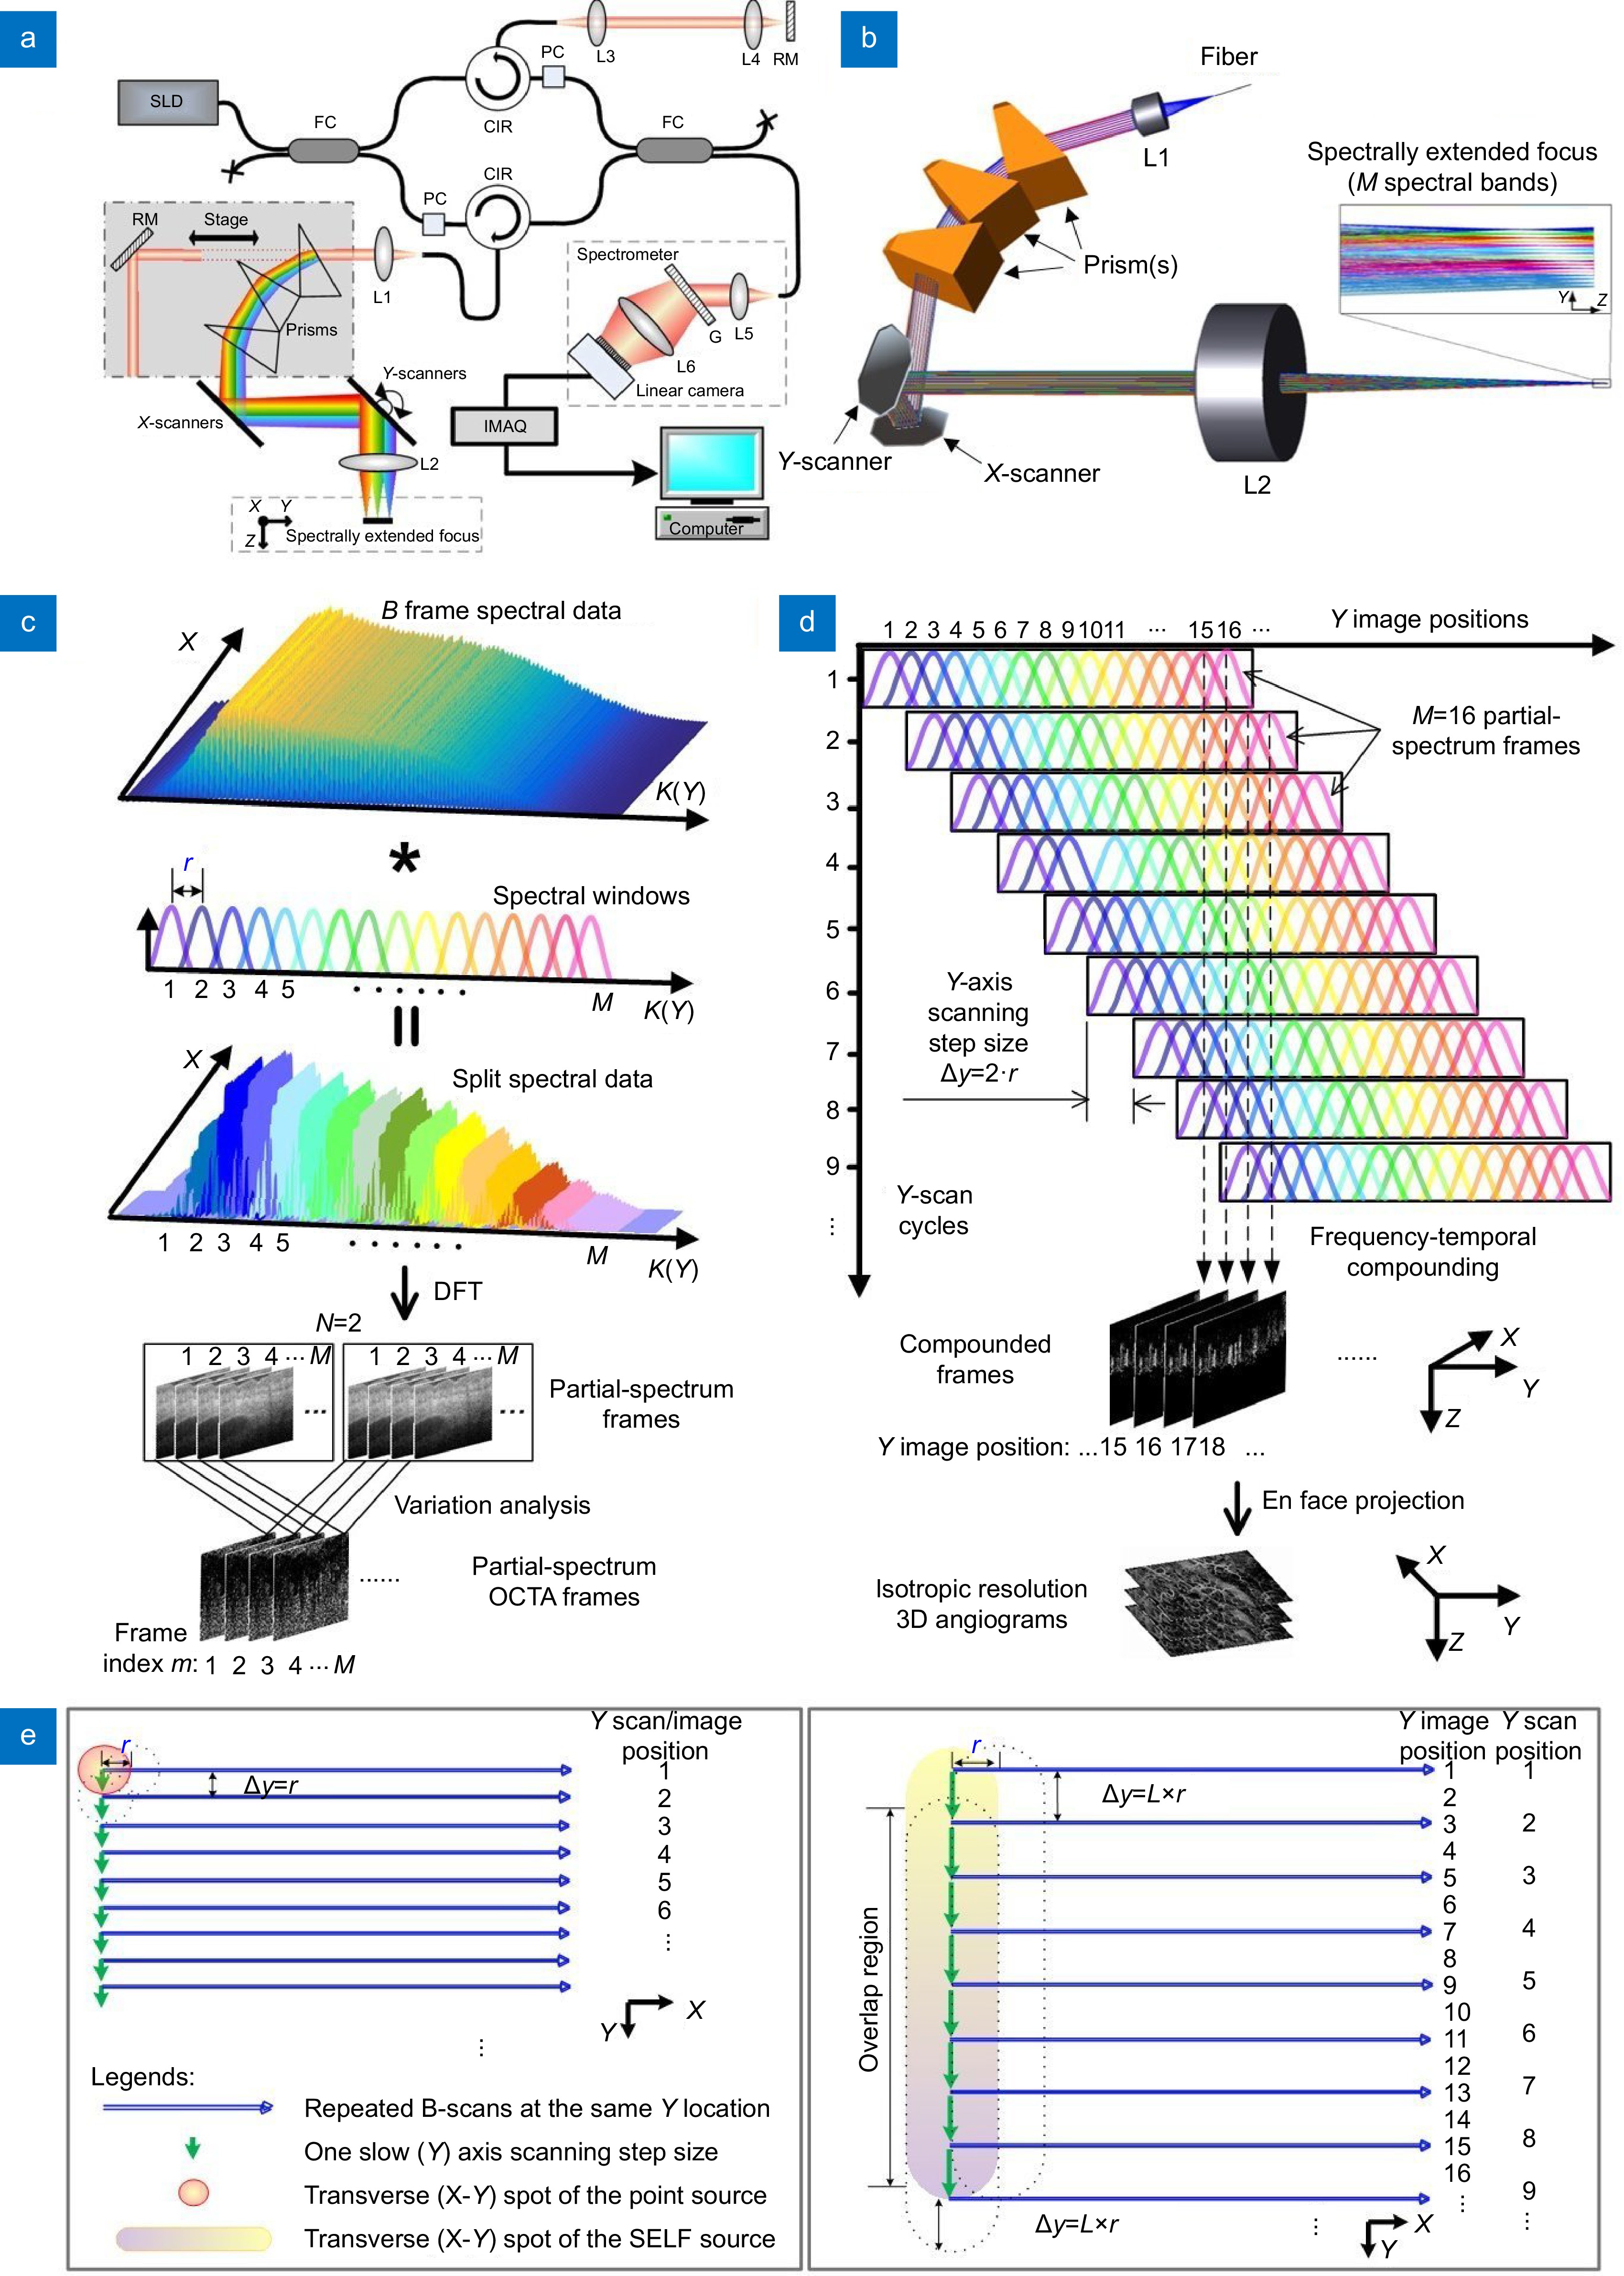
Figure 1.
SELF-OCTA working principle. (a, b) Schematics of the 1300 nm system for skin imaging (a) and the sample arm of the system (b). SLD: superluminescent diode source; FC: fiber coupler; PC: polarization controller; CIR: circulator; L1–5: achromatic lenses; L6: camera lens; RM: reflective mirror; G: transmission grating; IMAQ: image acquisition card. (c) Process of splitting spectrum and generating partial-spectrum OCTA frame. K: wavenumber; M: the number of spectral bands, r: the transverse distance between two adjacent scan positions. DFT: discrete Fourier transform. (d) Schematics of signal mapping from partial-spectrum frames acquired over M/L consecutive Y-scan cycles to their Y image positions with M = 16 and L = 2. (e) Comparison of beam scanning between the point-scanning configuration where scanning step size along Y axis ∆y = r (left) and the SELF configuration with ∆y = L*r where L = 2 (right).
-
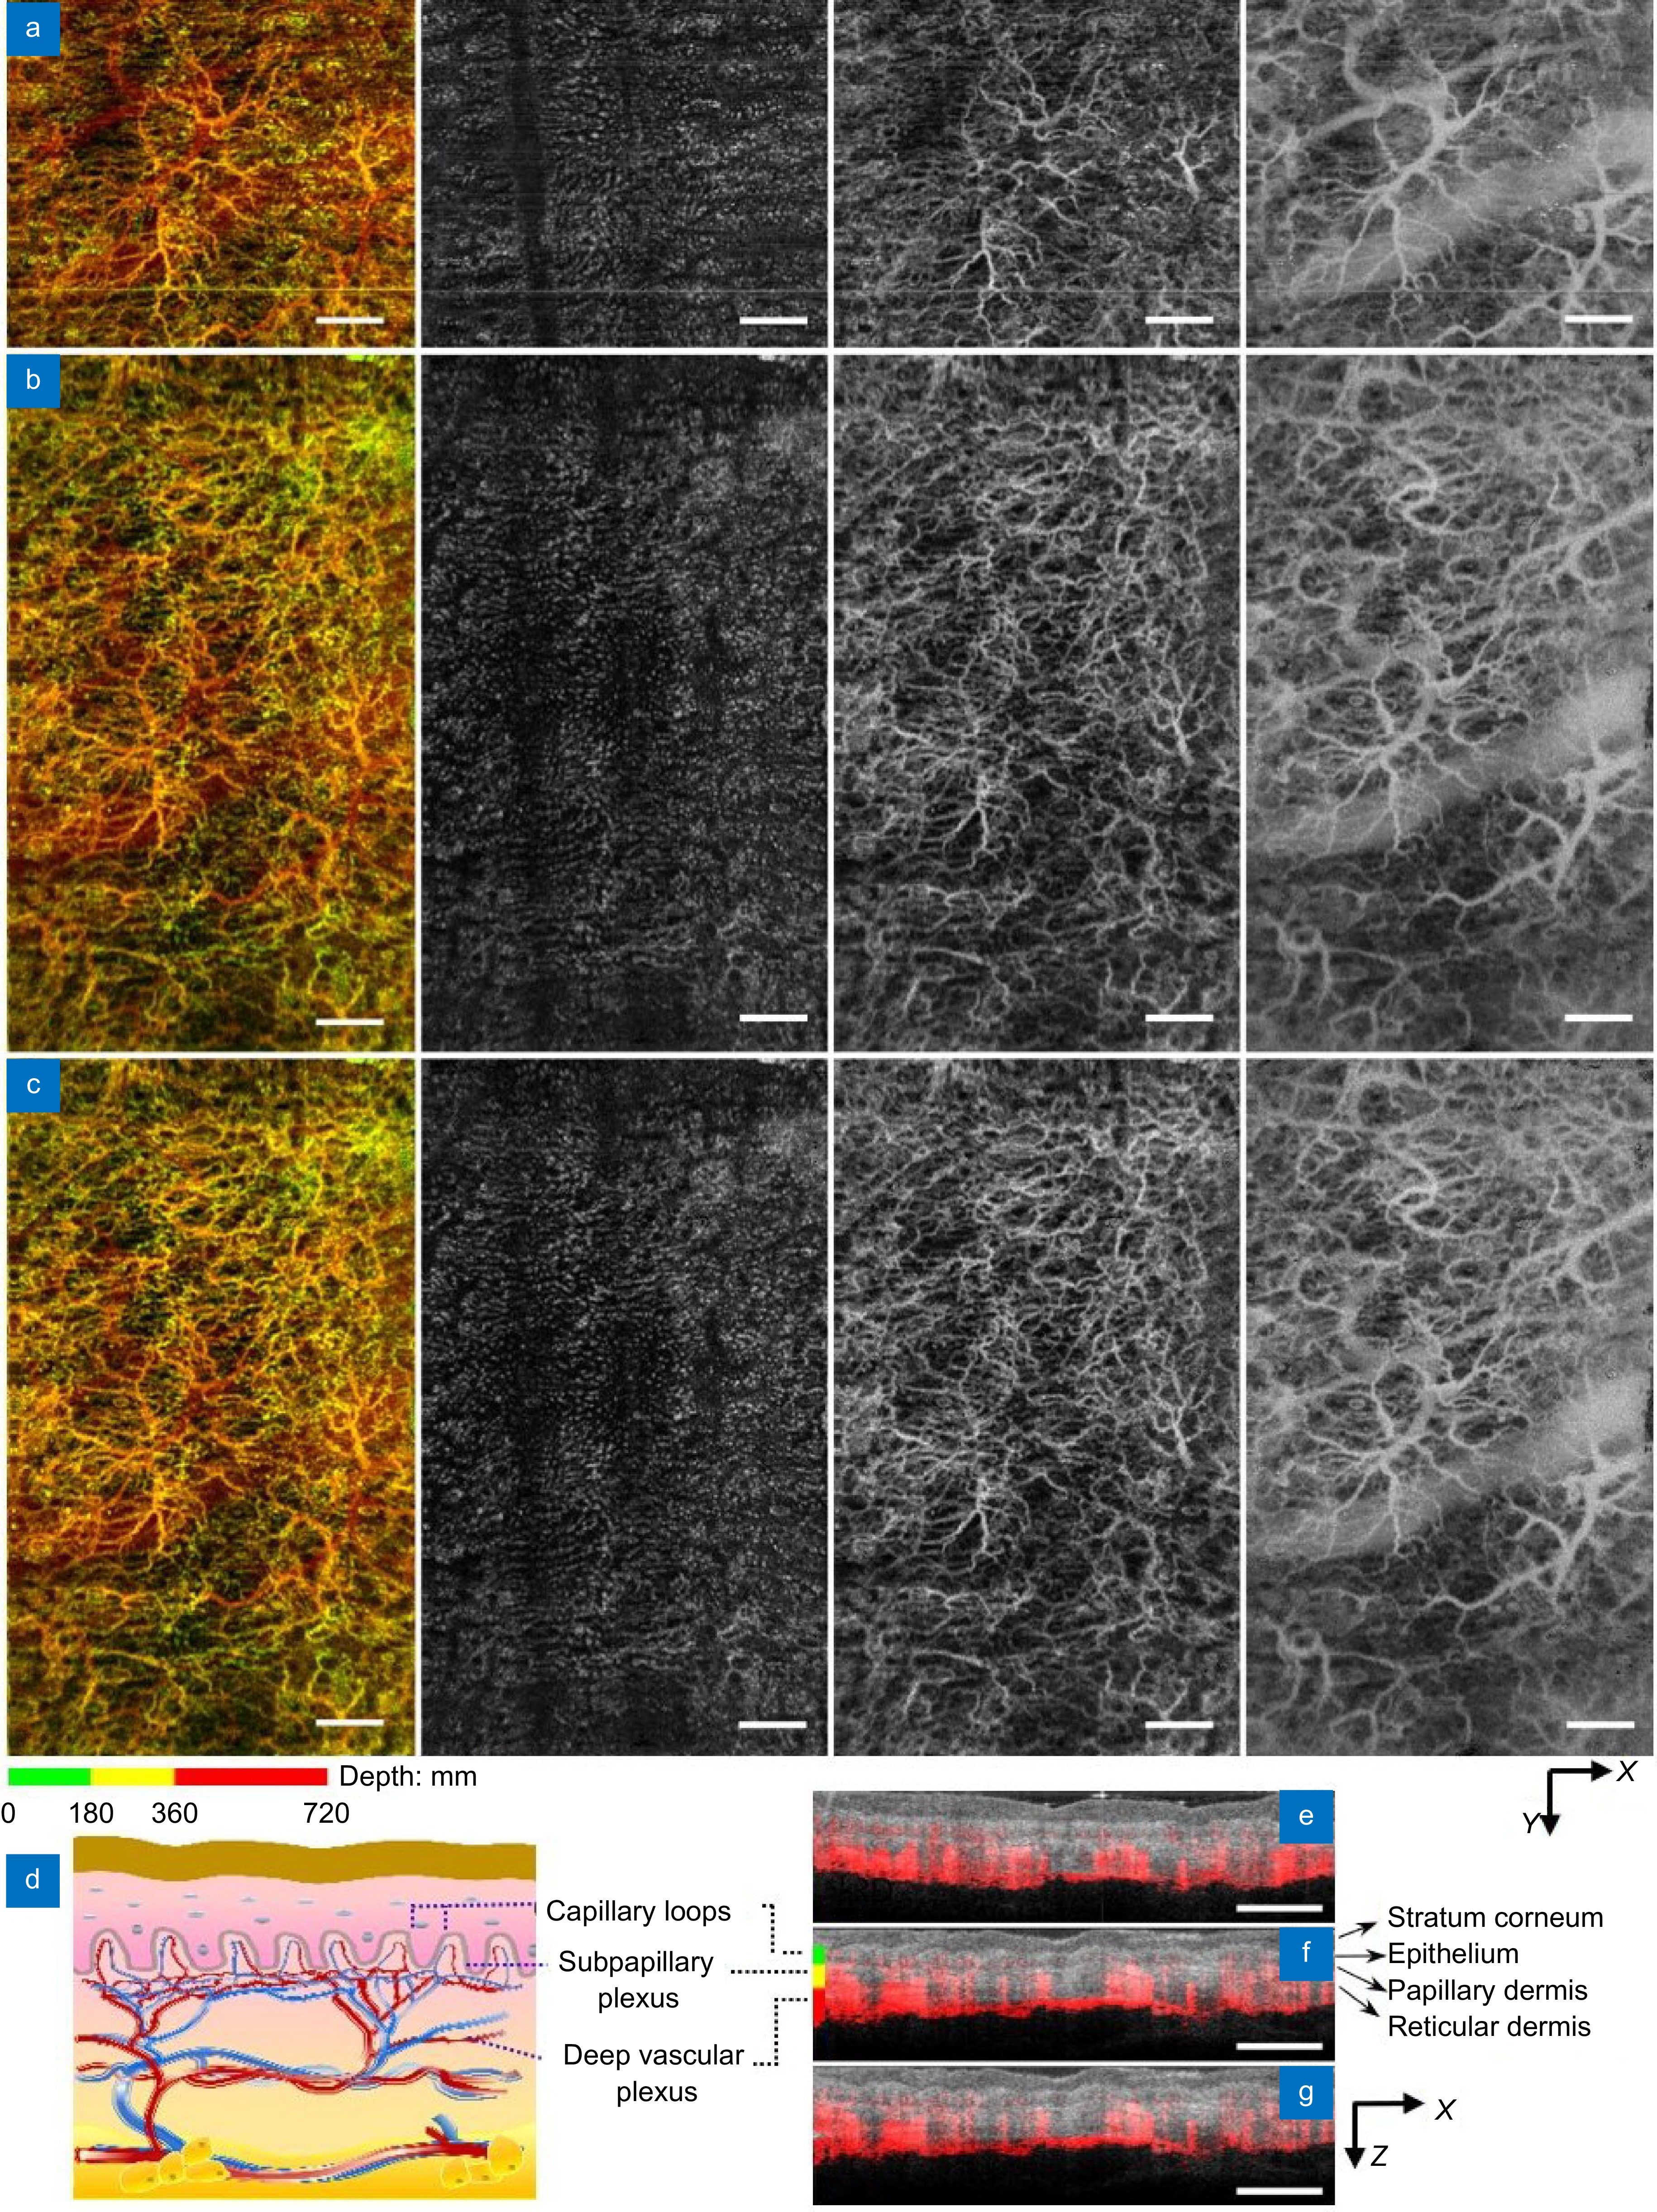
Figure 2.
Comparison of field of view in the human skin using 1300 nm system. (a–c) En face projections of vasculatures obtained with the point-scanning configuration (a), SELF configuration with M = 16 and L = 2 before (b) and after Y-deconvolution (c). From left to right: full-thickness projection (first column), capillary loops (second column), subpapillary plexus (third column), and deep vascular plexus (fourth column). Skin slabs are coded with green, yellow, and red in the full-thickness projection, respectively. (d) A schematic of skin vasculatures at different depth. (e–g) OCTA blood flow signal (red) superimposed on the OCT structural images (gray) with the point-scanning configuration (e), SELF configuration before (f) and after Y-deconvolution (g). Scale bars: 1 mm.
-
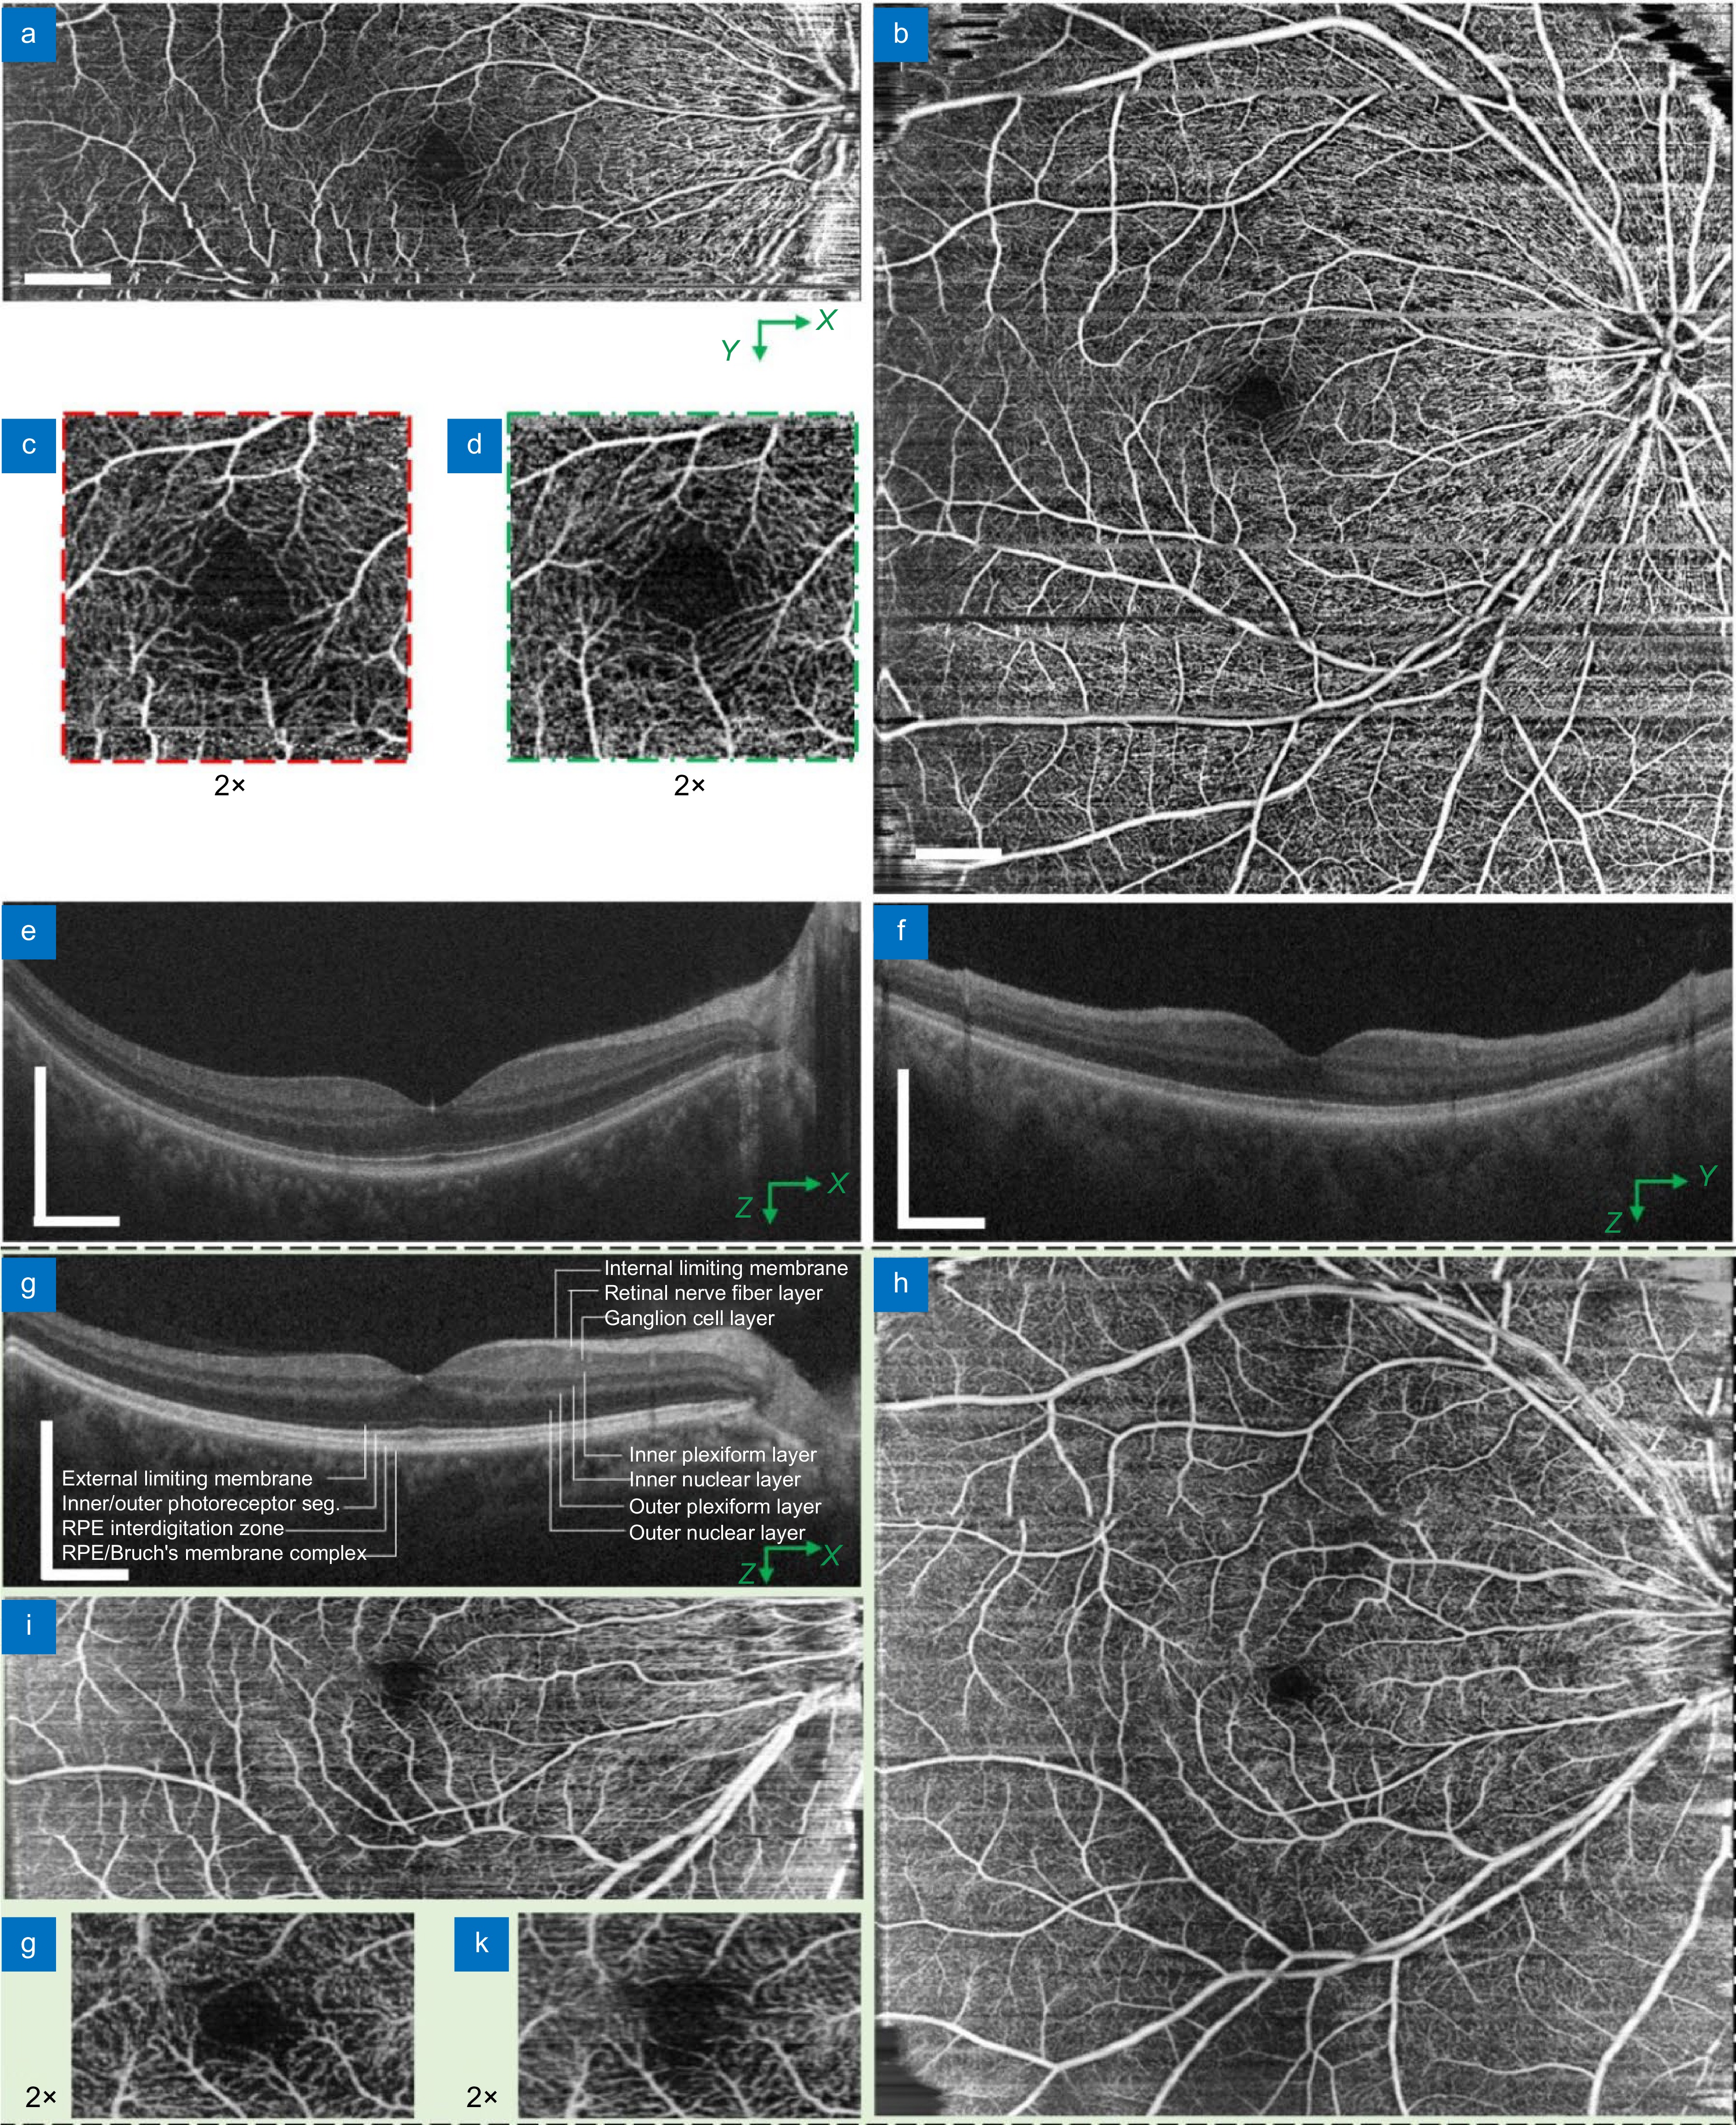
Figure 3.
Comparison of field of view in the human retina using 850 nm system at 68 kHz. (a–f) Images obtained from a female subject using 850 nm system with 90 nm spectral bandwidth: (a, b) OCTA en face projection with the point-scanning configuration over 12 mm × 4 mm (a) and the SELF-scanning configuration with M = 9 and L = 3 over 12 mm × 12 mm (b), respectively; (c, d) Corresponding zoom-in views of the fovea region acquired with the point (c) and SELF configuration (d), respectively; (e, f) Corresponding OCT structural image acquired with the point configuration (e) and SELF configuration after spectrum reconstruction (f). (g–k) Images obtained from a male subject using 850 nm system with 175 nm spectral bandwidth: (j) A partial-spectrum SELF-OCT cross-sectional image; (h, i) OCTA en face projections obtained with SELF configuration over 12 mm × 12 mm (h) and point configuration over 12 mm × 4 mm (i), respectively; (j, k) Corresponding zoom-in views of the fovea region acquired with the point (i) and SELF configuration (h), respectively. All OCT cross-sectional images are averaged over 2 consecutive images. Scale bars: 1 mm.
-
Figure 4.
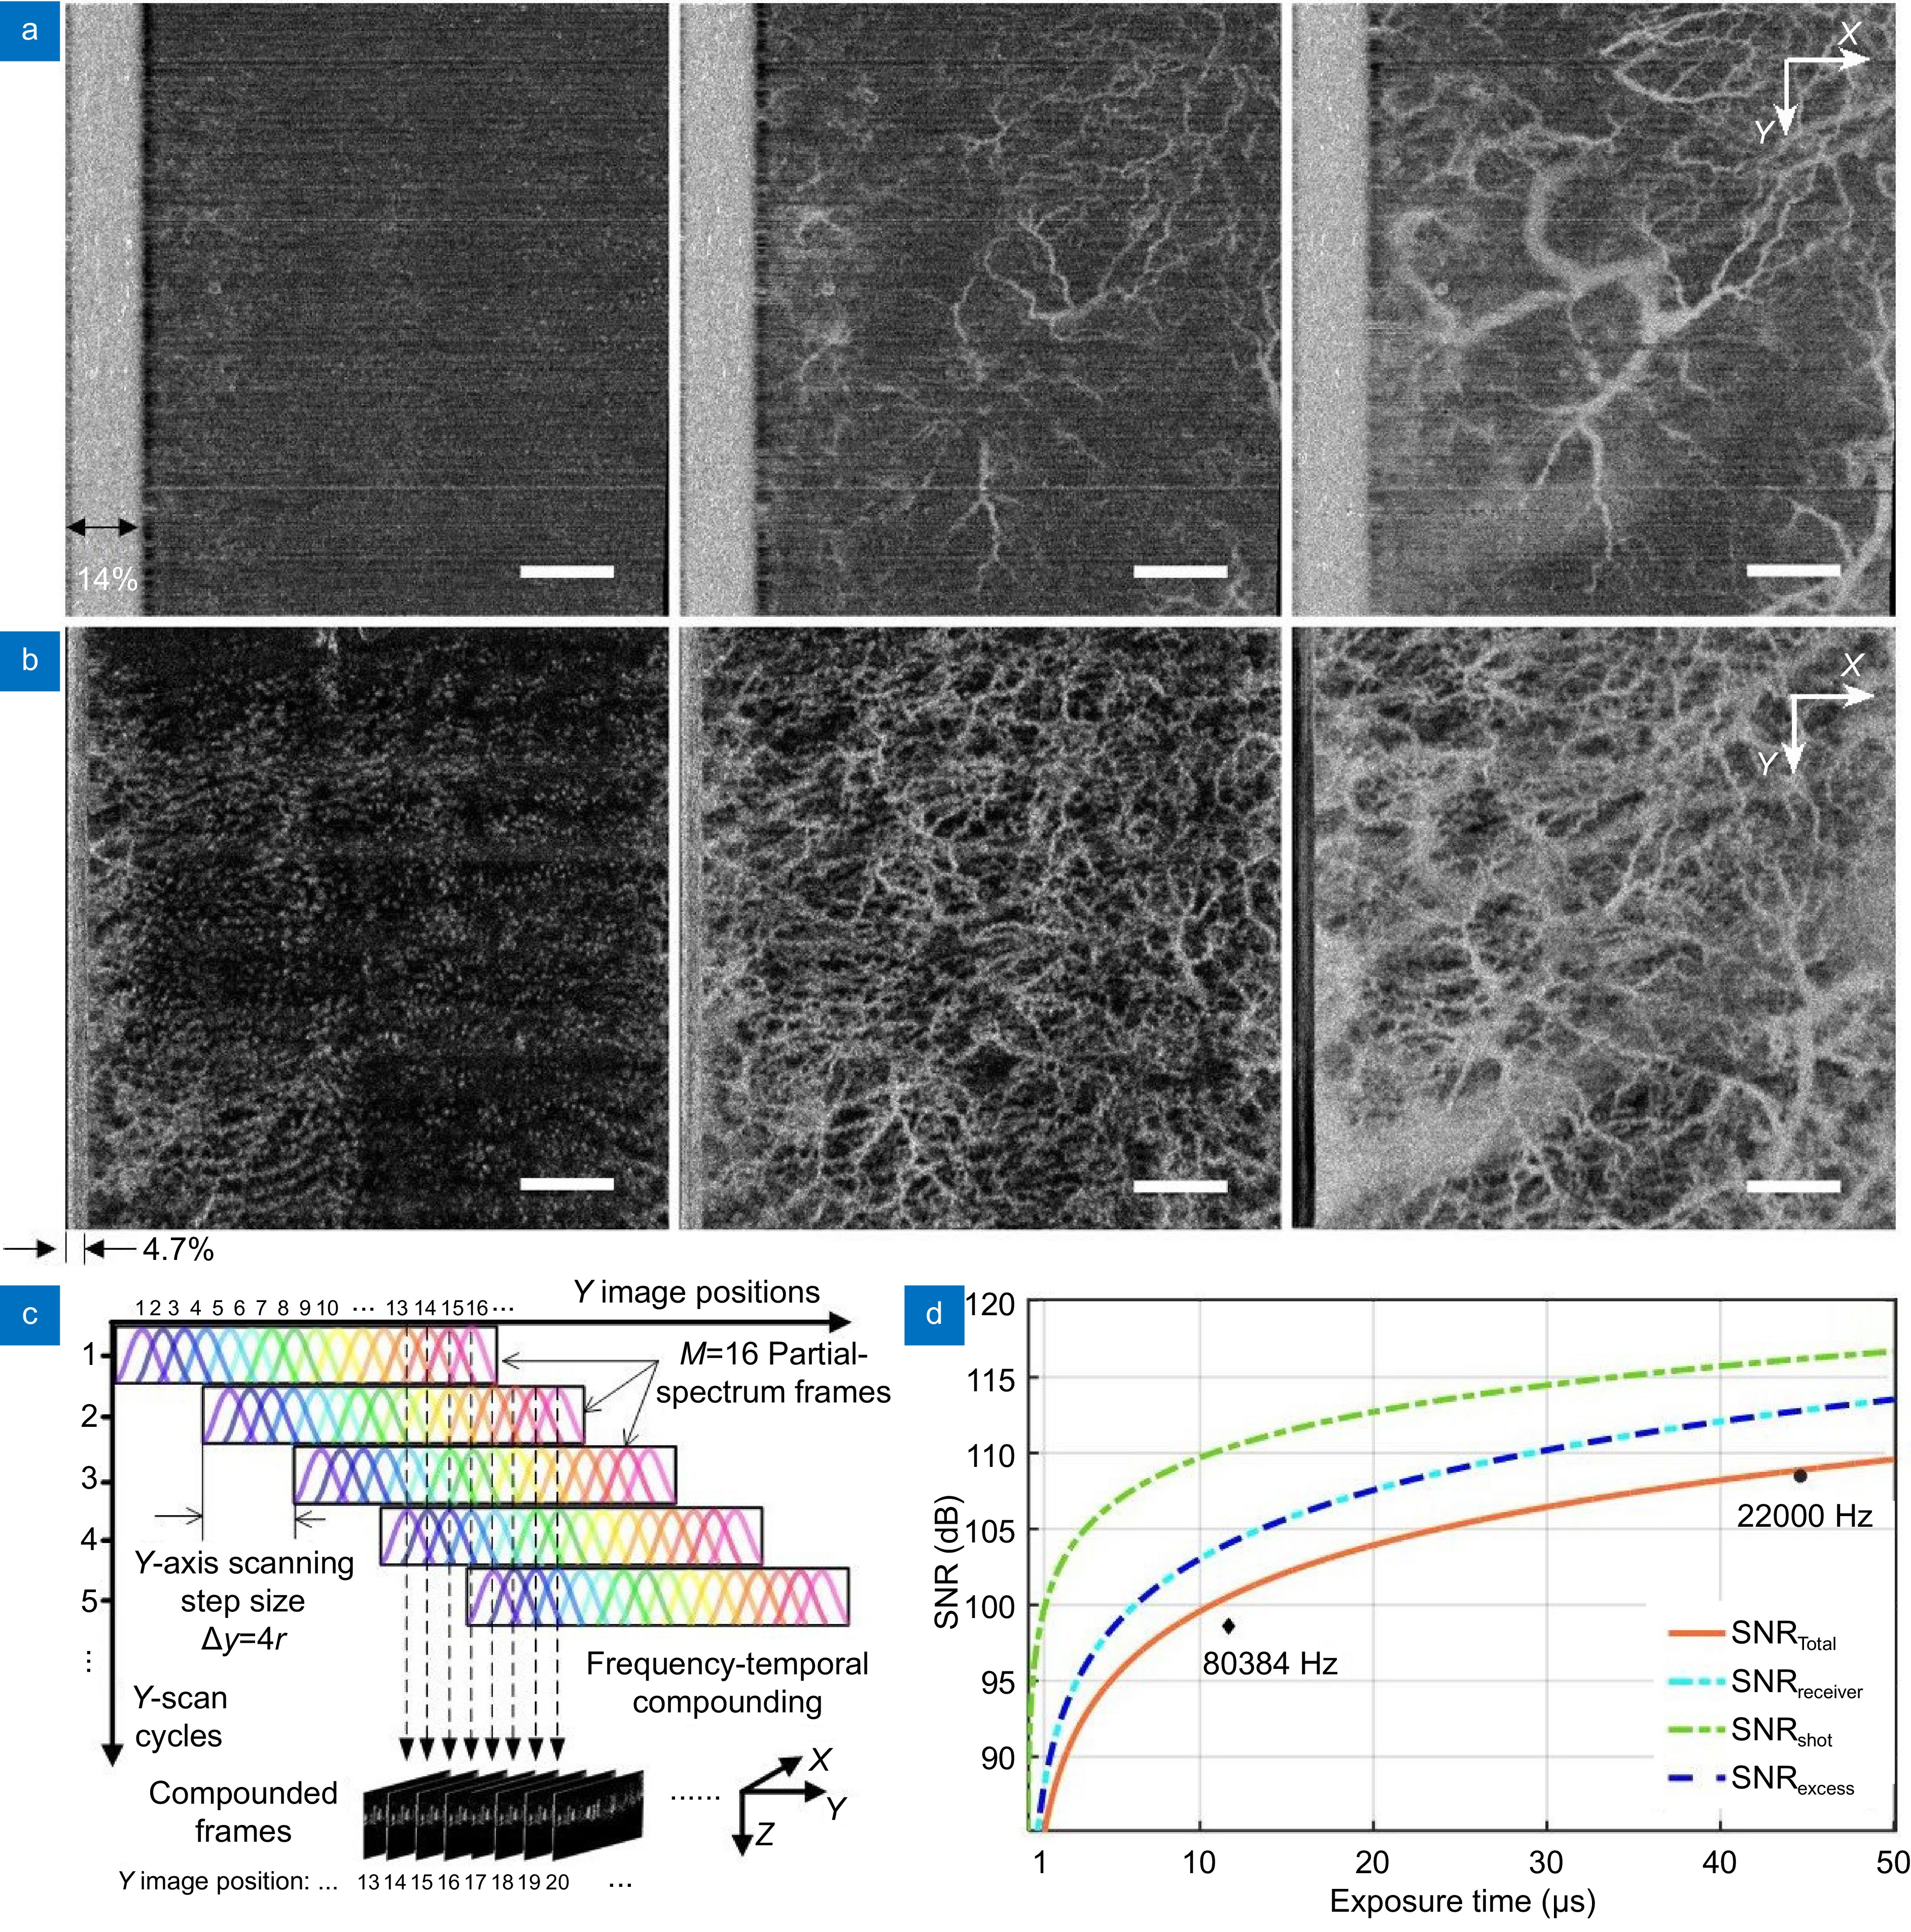
Comparison of sensitivity to slow flow in the human skin. (a) OCTA images with the point configuration at an A-scan rate of 80384 Hz giving a flyback of 14% FOV. (b) OCTA images with the SELF configuration at an A-scan rate of 22000 Hz with M = 16 and L = 4 having a flyback of 4.7% FOV. From left to right: En face OCTA projections of skin vasculatures of capillary loop (first column), subpapillary plexus (second column) and deep vascular plexus (third column). (c) Schematics of SELF-OCTA signal mapping from partial-spectrum frames acquired over M/L Y-scan cycles to their Y image position with M = 16, L = 4 and ∆y = 4r. (d) Signal-to-noise ratio (SNR) as a function of exposure time. Optimal theoretical SNR (SNRTotal, orange line) was obtained when SNRel = SNRex (cyan and blue line). Black diamond and dot indicate measured total SNR at 80384 Hz and 22000 Hz A-scan rates, respectively. SNRreceiver: signal to receiver noise ratio, SNRexcess: signal to excess noise ratio, SNRshot: signal to shot noise ratio. Scale bars: 1 mm.
-
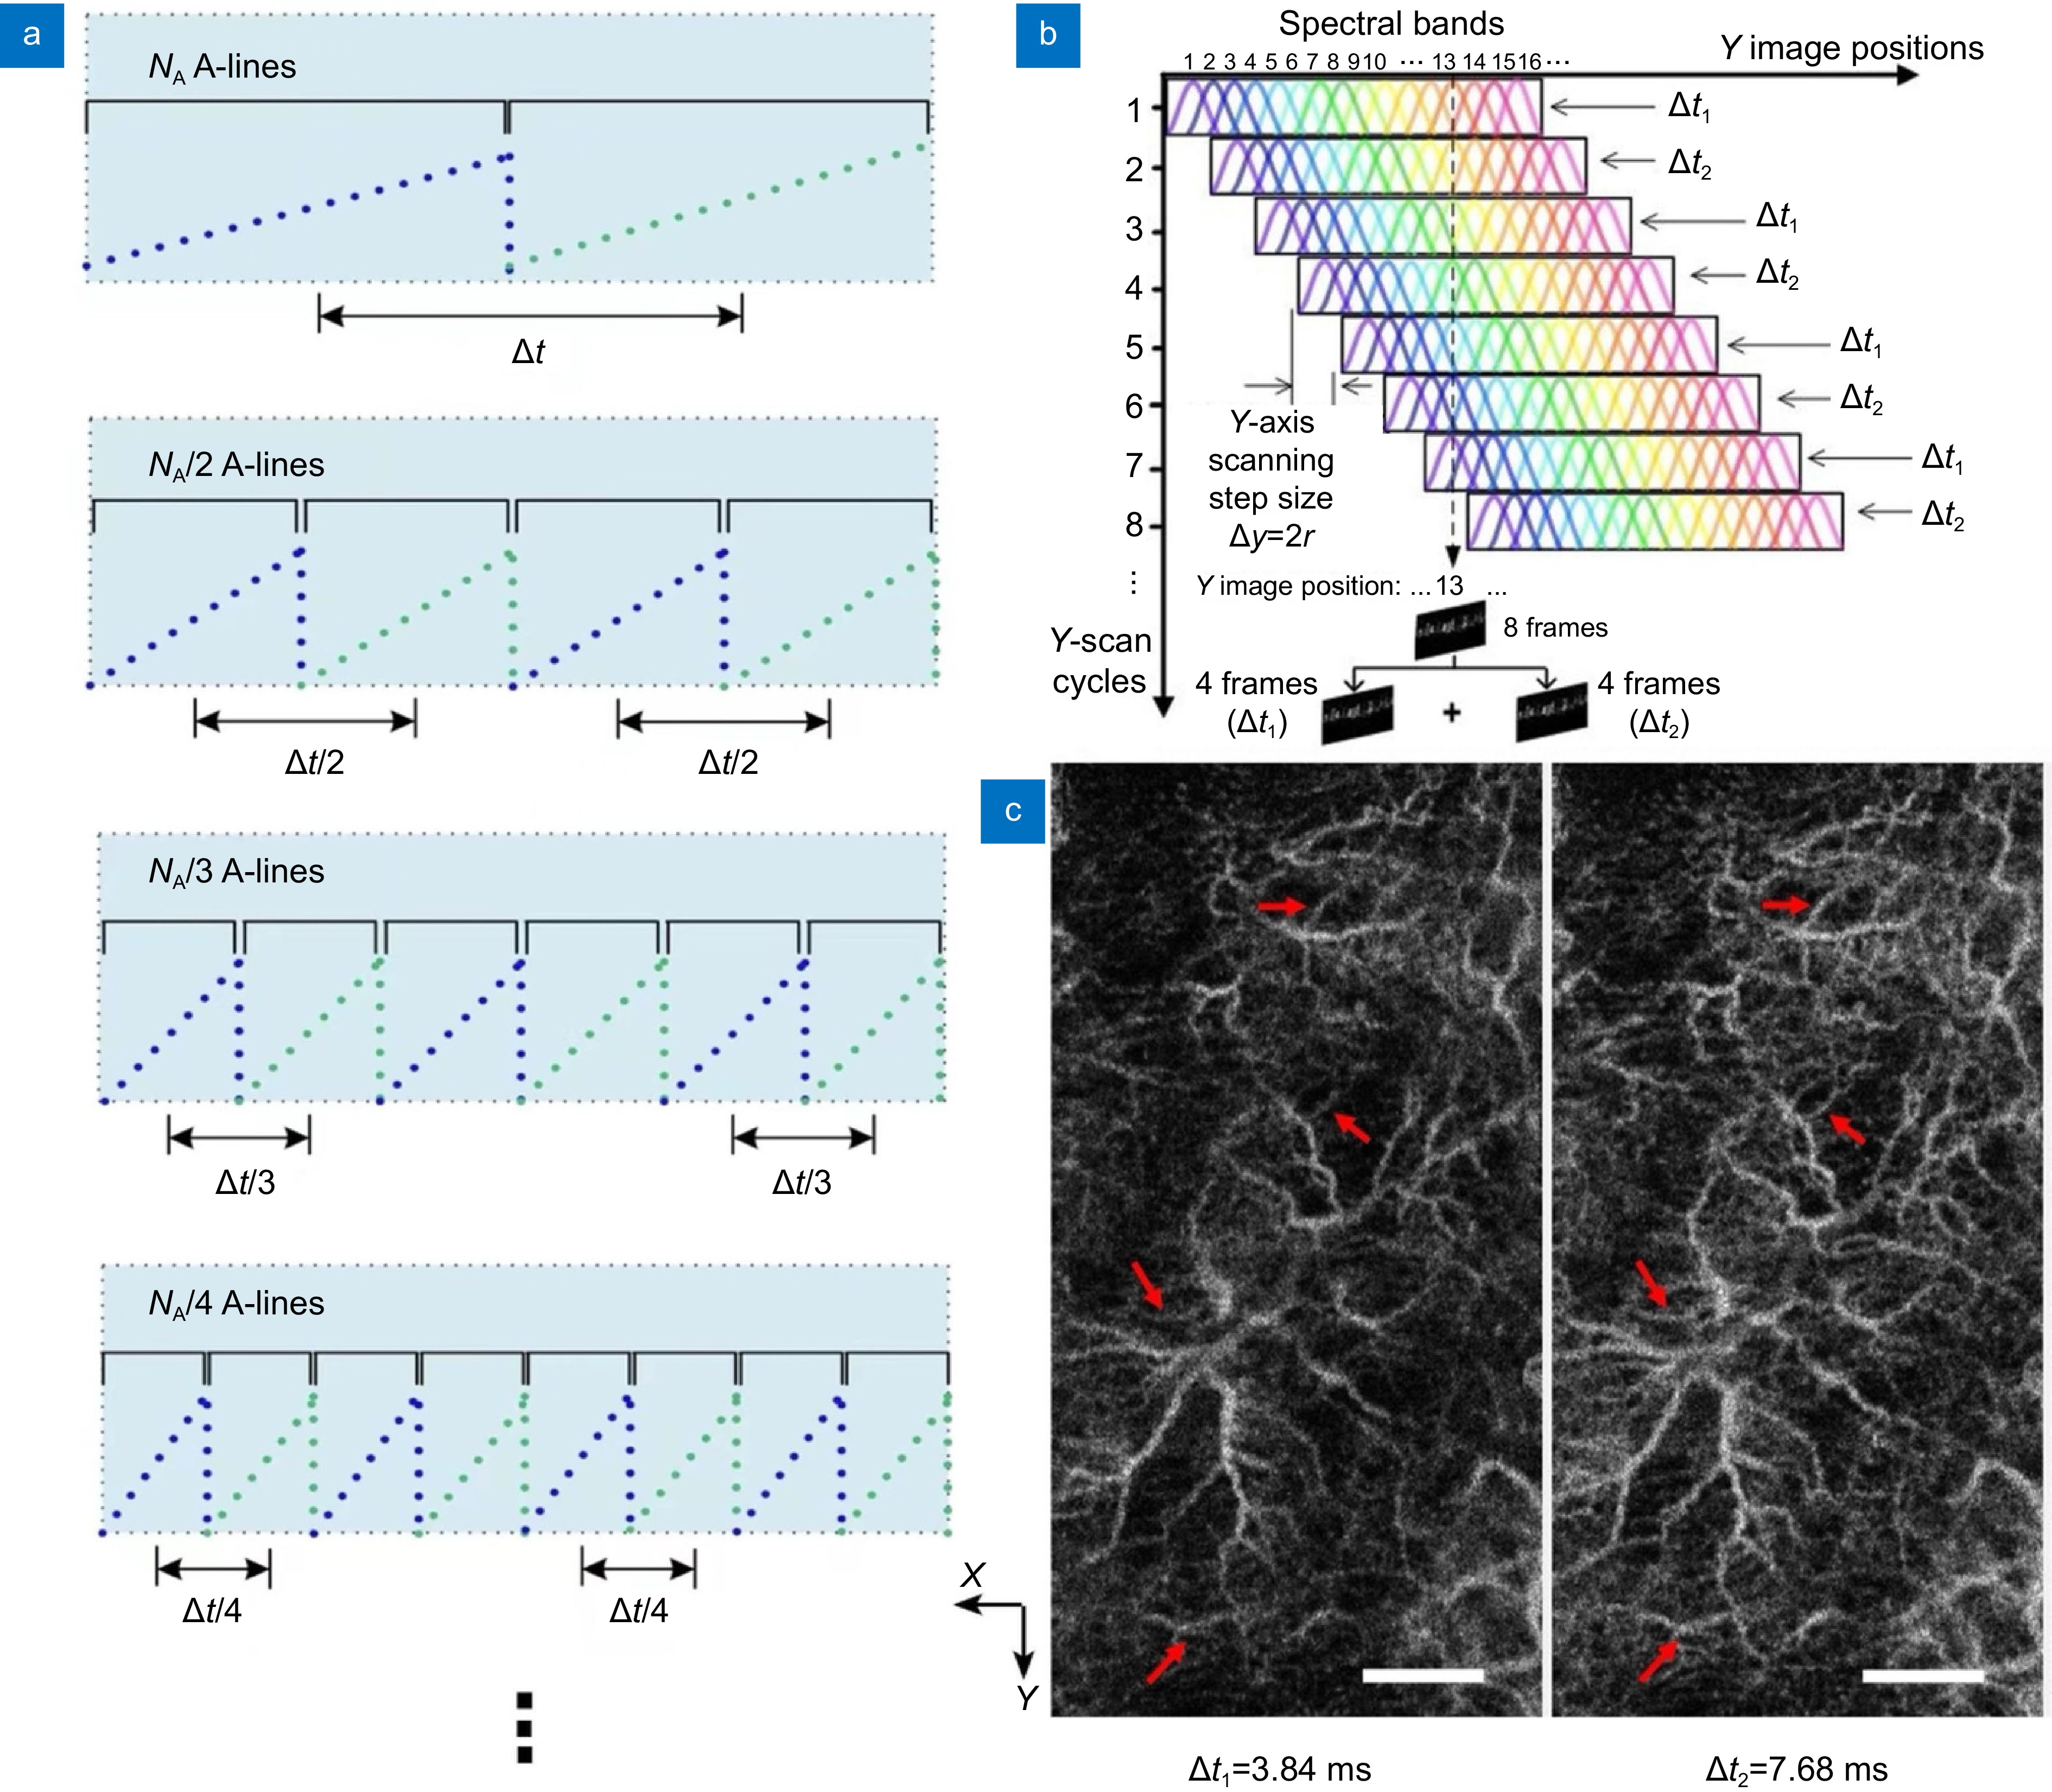
Figure 5.
Multiple interscan time OCTA in the human skin using the SELF scanning configuration. (a) Schematics of customized interlaced scanning protocol. Blue and green dot lines represent A-scan points in
$$ -
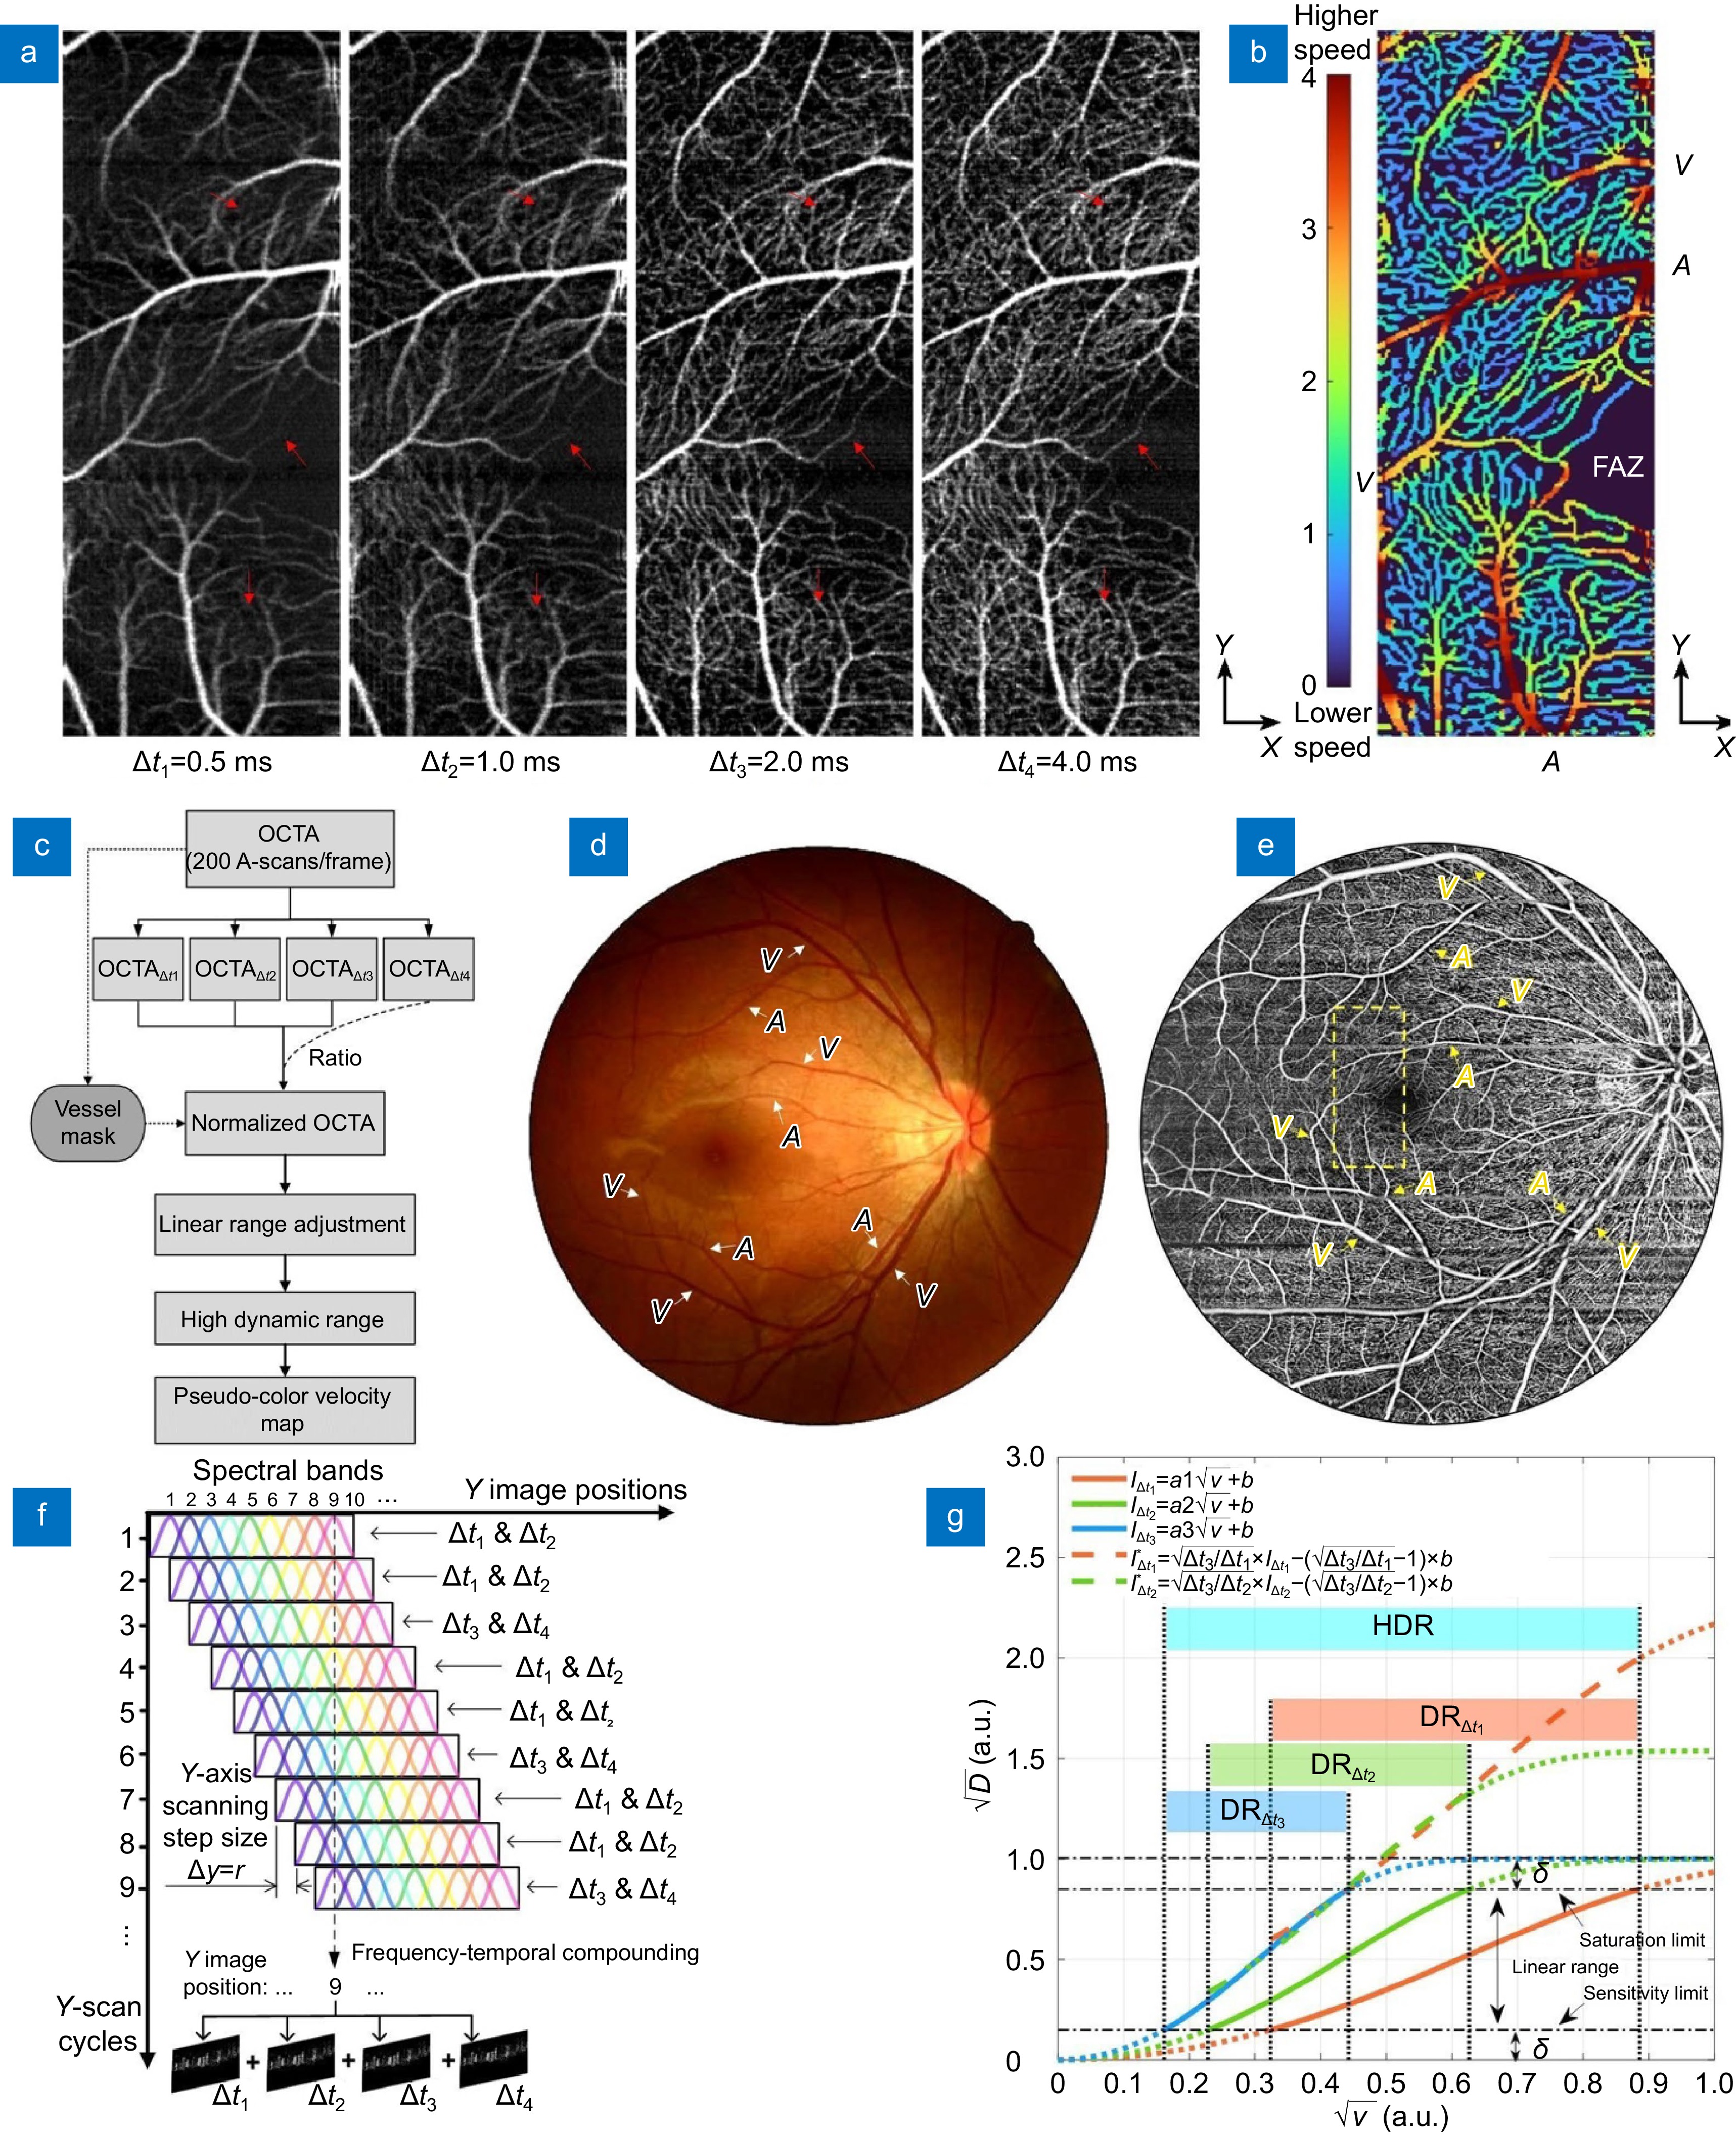
Figure 6.
Multiple interscan time OCTA and relative flow velocity with high dynamic range in the human retina using the SELF configuration at 100 kHz. (a) En face projections of retinal vasculatures with 4 different interscan time intervals reconstructed from a single volume scan of 3 (N) × 200 (X) × 400 (Y) A-lines. (b) Corresponding pseudo color-coded relative flow velocity map with dynamic ranges contributed by ∆t1, ∆t2 and ∆t3. (c) Workflow for blood flow velocity map generation. (d, e) Corresponding fundus photograph (d) and OCTA image (e, adapted from Fig. 3(b)) from the same subject over 12 mm × 12 mm area (a 45-degree angle). Dashed box in (e) corresponding to imaging area in (a, b). (f) Schematics of SELF-OCTA signal mapping with M = 9, L = 1, and ∆y = r. Each Y image position has partial-spectrum frames encoding 4 different interscan time intervals. (g) Numerical simulations of OCTA signal and flow velocity: square root of amplitude decorrelation (
$ \sqrt{D} $ $ \sqrt{v} $ $ {I}_{{\rm{\Delta}} t1}^{\mathrm{*}} $ $ {I}_{{\rm{\Delta}} t2}^{\mathrm{*}} $ $ {I}_{{\rm{\Delta}} t3} $


