
 E-mail Alert
 RSS
RSS
| Citation: |
Du E, Shen SH, Qiu AQ, Chen NG. Confocal laser speckle autocorrelation imaging of dynamic flow in microvasculature. Opto-Electron Adv 5, 210045 (2022). doi: 10.29026/oea.2022.210045

|
Confocal laser speckle autocorrelation imaging of dynamic flow in microvasculature
-
Abstract
Laser speckle imaging has been widely used for in-vivo visualization of blood perfusion in biological tissues. However, existing laser speckle imaging techniques suffer from limited quantification accuracy and spatial resolution. Here we report a novel design and implementation of a powerful laser speckle imaging platform to solve the two critical limitations. The core technique of our platform is a combination of line scan confocal microscopy with laser speckle autocorrelation imaging, which is termed Line Scan Laser Speckle Autocorrelation Imaging (LS-LSAI). The technical advantages of LS-LSAI include high spatial resolution (~4.4 μm) for visualizing and quantifying blood flow in microvessels, as well as video-rate imaging speed for tracing dynamic flow.-
Keywords:
- laser speckle /
- autocorrelation /
- confocal /
- line scan /
- flow
-

-
References
[1] Fagrell B, Intaglietta M. Microcirculation: its significance in clinical and molecular medicine. J Intern Med 241, 349–362 (1997). doi: 10.1046/j.1365-2796.1997.125148000.x [2] Folkman J. Angiogenesis in cancer, vascular, rheumatoid and other disease. Nat Med 1, 27–30 (1995). doi: 10.1038/nm0195-27 [3] Carmeliet P, Jain RK. Angiogenesis in cancer and other diseases. Nature 407, 249–257 (2000). doi: 10.1038/35025220 [4] Fercher AF, Briers JD. Flow visualization by means of single-exposure speckle photography. Opt Commun 37, 326–330 (1981). doi: 10.1016/0030-4018(81)90428-4 [5] Dunn AK, Bolay H, Moskowitz MA, Boas DA. Dynamic imaging of cerebral blood flow using laser speckle. J Cereb Blood Flow Metab 21, 195–201 (2001). doi: 10.1097/00004647-200103000-00002 [6] Postnov DD, Erdener SE, Tang JB, Boas DA. Dynamic laser speckle imaging: beyond the contrast (Conference Presentation). Proc SPIE 10877, 108770A (2019). [7] Williams SA, Wasserman S, Rawlinson DW, Kitney RI, Smaje LH et al. Dynamic measurement of human capillary blood pressure. Clin Sci 74, 507–512 (1988). [8] Fedorovich AA, Drapkina OM, Pronko KN, Sinopalnikov VI, Zemskov VM. Telemonitoring of capillary blood flow in the human skin: new opportunities and prospects. Clin Pract 15, 561–567 (2018). [9] Briers JD, Fercher AF. Retinal blood-flow visualization by means of laser speckle photography. Invest Ophthalmol Vis Sci 22, 255–259 (1982). [10] Tamaki Y, Araie M, Kawamoto E, Eguchi S, Fujii H. Noncontact, two-dimensional measurement of retinal microcirculation using laser speckle phenomenon. Invest Ophthalmol Vis Sci 35, 3825–3834 (1994). [11] Cheng HY, Yan YM, Duong TQ. Temporal statistical analysis of laser speckle images and its application to retinal blood-flow imaging. Opt Express 16, 10214–10219 (2008). doi: 10.1364/OE.16.010214 [12] Nagahara M, Tamaki Y, Tomidokoro A, Araie M. In vivo measurement of blood velocity in human major retinal vessels using the laser speckle method. Invest Ophthalmol Vis Sci 52, 87–92 (2011). doi: 10.1167/iovs.09-4422 [13] Briers JD, Webster S. Laser speckle contrast analysis (LASCA): a nonscanning, full-field technique for monitoring capillary blood flow. J Biomed Opt 1, 174–179 (1996). doi: 10.1117/12.231359 [14] Mahé G, Humeau-Heurtier A, Durand S, Leftheriotis G, Abraham P. Assessment of skin microvascular function and dysfunction with laser speckle contrast imaging. Circ Cardiovasc Imaging 5, 155–163 (2012). doi: 10.1161/CIRCIMAGING.111.970418 [15] Bolay H, Reuter U, Dunn AK, Huang ZH, Boas DA et al. Intrinsic brain activity triggers trigeminal meningeal afferents in a migraine model. Nat Med 8, 136–142 (2002). doi: 10.1038/nm0202-136 [16] Li PC, Ni SL, Zhang L, Zeng SQ, Luo QM. Imaging cerebral blood flow through the intact rat skull with temporal laser speckle imaging. Opt Lett 31, 1824–1826 (2006). doi: 10.1364/OL.31.001824 [17] Zakharov P, Völker AC, Wyss MT, Haiss F, Calcinaghi N et al. Dynamic laser speckle imaging of cerebral blood flow. Opt Express 17, 13904–13917 (2009). doi: 10.1364/OE.17.013904 [18] Parthasarathy AB, Kazmi SMS, Dunn AK. Quantitative imaging of ischemic stroke through thinned skull in mice with Multi Exposure Speckle Imaging. Biomed Opt Express 1, 246–259 (2010). doi: 10.1364/BOE.1.000246 [19] Dunn AK. Laser speckle contrast imaging of cerebral blood flow. Ann Biomed Eng 40, 367–377 (2012). doi: 10.1007/s10439-011-0469-0 [20] Kazmi SMS, Richards LM, Schrandt CJ, Davis MA, Dunn AK. Expanding applications, accuracy, and interpretation of laser speckle contrast imaging of cerebral blood flow. J Cereb Blood Flow Metab 35, 1076–1084 (2015). doi: 10.1038/jcbfm.2015.84 [21] Chen M, Wen D, Huang SL, Gui S, Zhang ZH et al. Laser speckle contrast imaging of blood flow in the deep brain using microendoscopy. Opt Lett 43, 5627–5630 (2018). doi: 10.1364/OL.43.005627 [22] Boas DA, Dunn AK. Laser speckle contrast imaging in biomedical optics. J Biomed Opt 15, 011109 (2010). doi: 10.1117/1.3285504 [23] Senarathna J, Rege A, Li N, Thakor NV. Laser speckle contrast imaging: theory, instrumentation and applications. IEEE Rev Biomed Eng 6, 99–110 (2013). doi: 10.1109/RBME.2013.2243140 [24] Briers D, Duncan DD, Hirst ER, Kirkpatrick SJ, Larsson M et al. Laser speckle contrast imaging: theoretical and practical limitations. J Biomed Opt 18, 066018 (2013). doi: 10.1117/1.JBO.18.6.066018 [25] Vaz PG, Humeau-Heurtier A, Figueiras E, Correia C, Cardoso J. Laser speckle imaging to monitor microvascular blood flow: a review. IEEE Rev Biomed Eng 9, 106–120 (2016). doi: 10.1109/RBME.2016.2532598 [26] Heeman W, Steenbergen W, van Dam GM, Boerma EC. Clinical applications of laser speckle contrast imaging: a review. J Biomed Opt 24, 080901 (2019). [27] Duncan DD, Kirkpatrick SJ. Can laser speckle flowmetry be made a quantitative tool? J Opt Soc Am A Opt Image Sci Vis 25, 2088–2094 (2008). doi: 10.1364/JOSAA.25.002088 [28] Parthasarathy AB, Tom WJ, Gopal A, Zhang XJ, Dunn AK. Robust flow measurement with multi-exposure speckle imaging. Opt Express 16, 1975–1989 (2008). doi: 10.1364/OE.16.001975 [29] Parthasarathy AB, Weber EL, Richards LM, Fox DJ, Dunn AK. Laser speckle contrast imaging of cerebral blood flow in humans during neurosurgery: a pilot clinical study. J Biomed Opt 15, 066030 (2010). doi: 10.1117/1.3526368 [30] Richards LM, Towle EL, Fox DJ, Dunn AK. Intraoperative laser speckle contrast imaging with retrospective motion correction for quantitative assessment of cerebral blood flow. Neurophotonics 1, 015006 (2014). [31] Hou J, Li RJ, Sun WM, Lv XK, Song LP et al. Laser speckle correlation imaging with optical clearance for blood flows. Proc SPIE 11190, 111903C (2019). [32] Chen NG, Pant S. Line-scan focal modulation microscopy: a comparison study (Conference Presentation). Proc SPIE 9713, 971308 (2016). doi: 10.1117/12.2212710 [33] Pant S, Duan YB, Xiong F, Chen NG. Augmented line-scan focal modulation microscopy for multi-dimensional imaging of zebrafish heart in vivo. Biomed Opt Express 8, 5698–5707 (2017). doi: 10.1364/BOE.8.005698 [34] Pant S, Li CX, Gong ZY, Chen NG. Line-scan focal modulation microscopy. J Biomed Opt 22, 50502 (2017). [35] Al-Qazwini Z, Ko ZYG, Mehta K, Chen NG. Ultrahigh-speed line-scan SD-OCT for four-dimensional in vivo imaging of small animal models. Biomed Opt Express 9, 1216–1228 (2018). doi: 10.1364/BOE.9.001216 [36] Du E, Shen SH, Chong SP, Chen NG. Multifunctional laser speckle imaging. Biomed Opt Express 11, 2007–2016 (2020). doi: 10.1364/BOE.388856 -
Supplementary Information
Supplementary information video S1 
Supplementary information video S1
Supplementary information video S1
-
Access History
Figures(6)
Article Metrics

Export File
Citation
Du E, Shen SH, Qiu AQ, Chen NG. Confocal laser speckle autocorrelation imaging of dynamic flow in microvasculature. Opto-Electron Adv 5, 210045 (2022). doi: 10.29026/oea.2022.210045
Format
Content
 DownLoad:

-
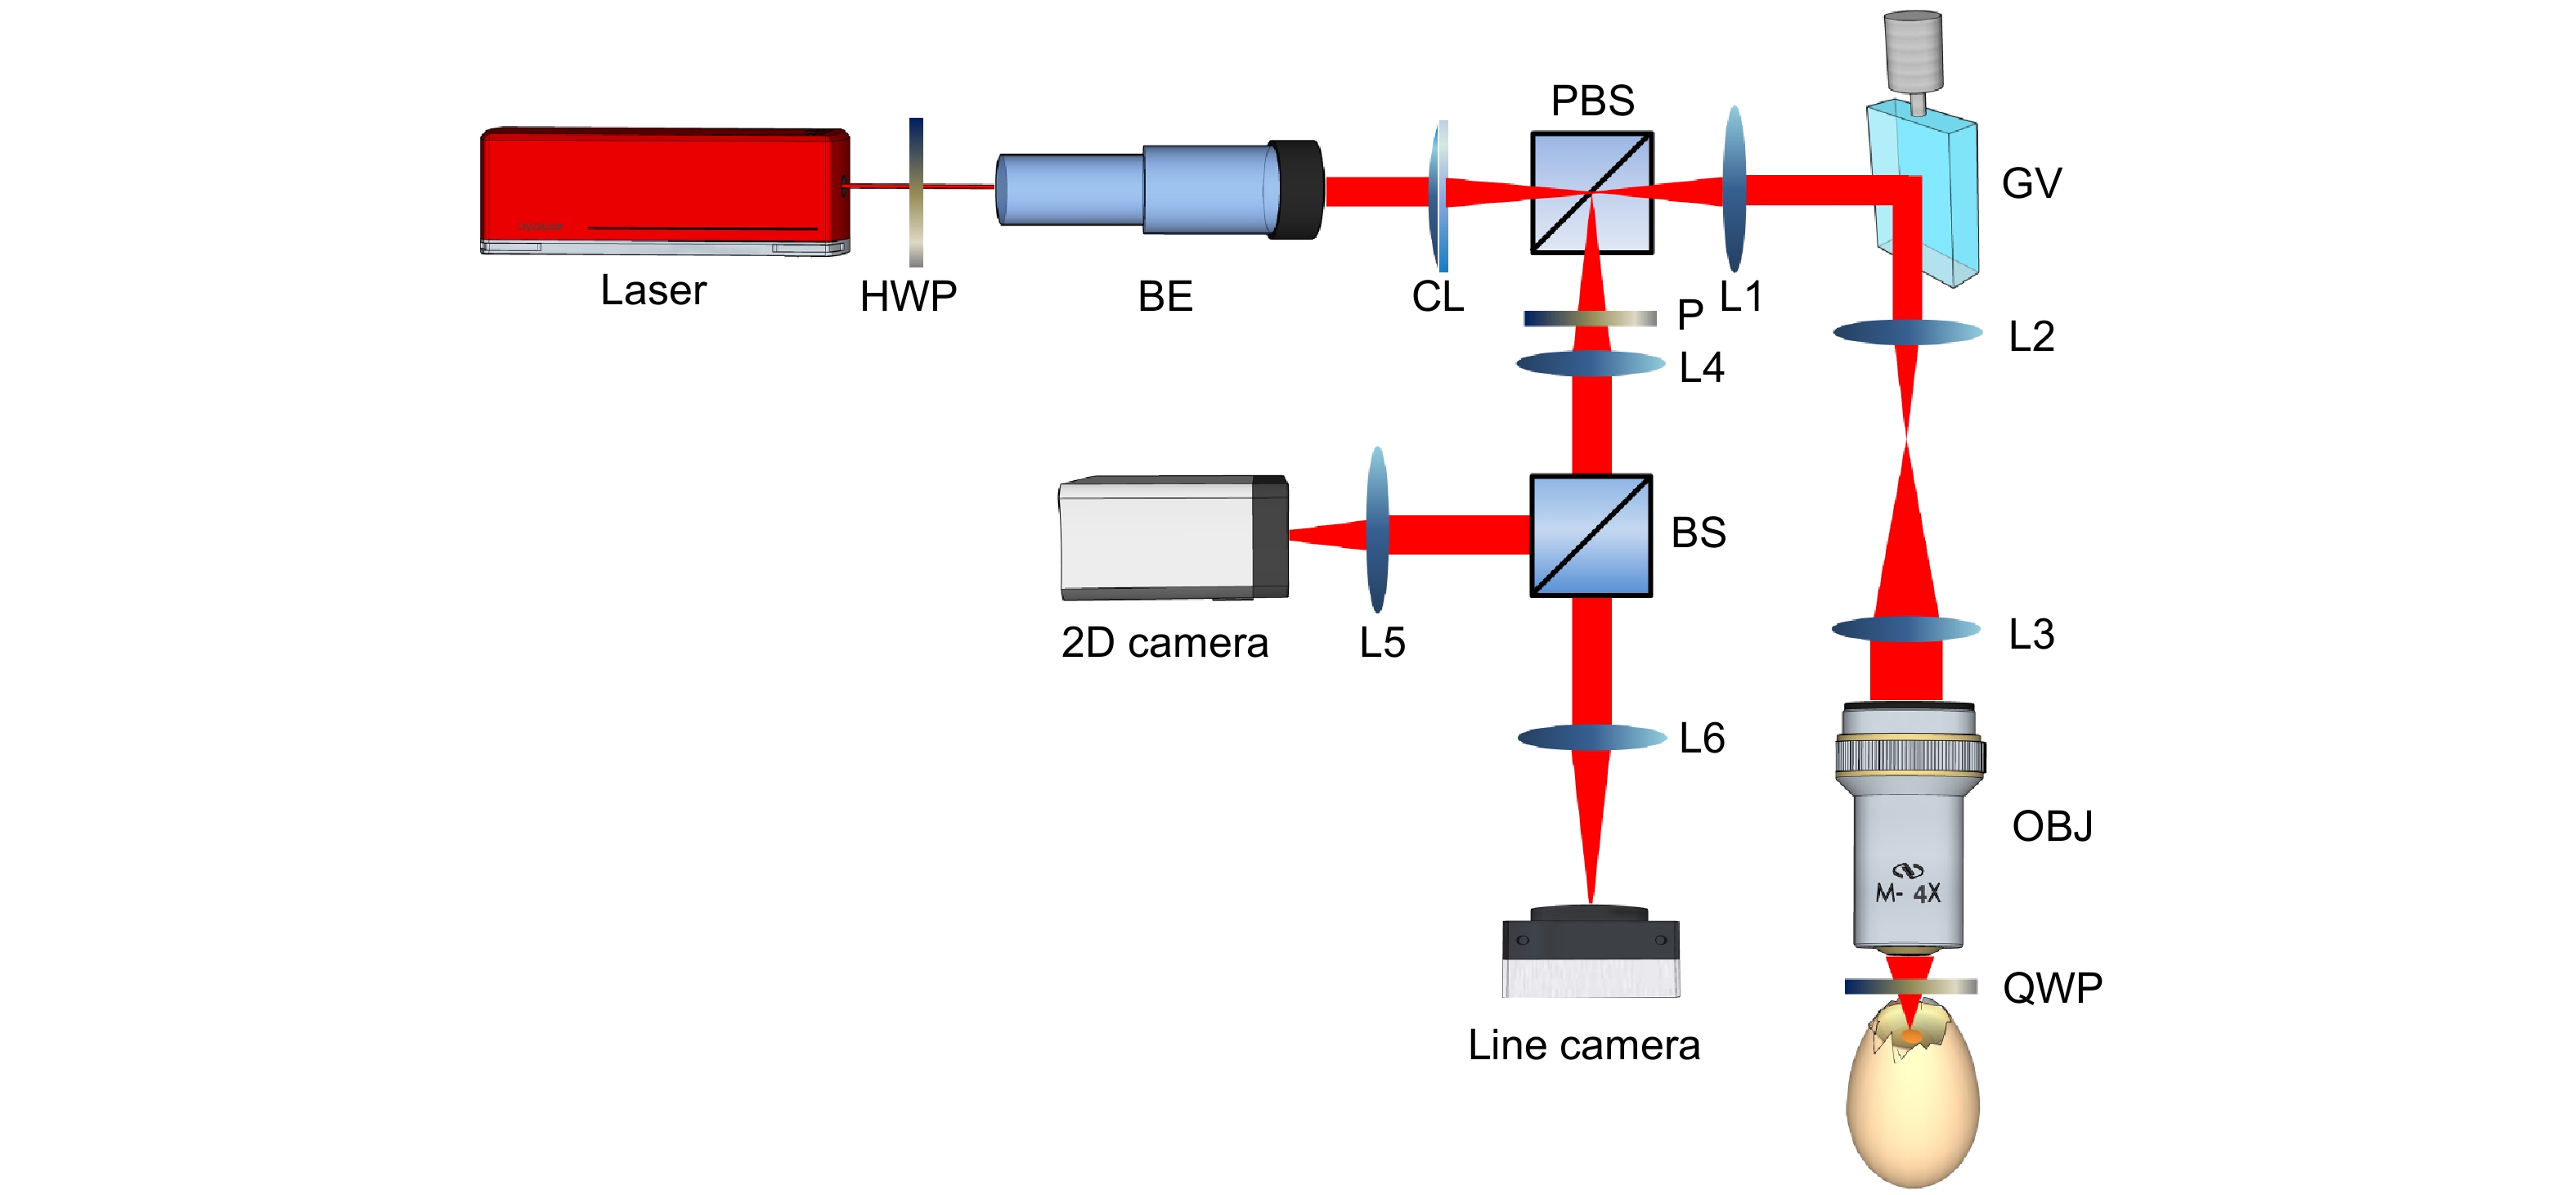
Figure 1.
Schematic diagram of laser speckle autocorrelation imaging system. HWP, half-wave plate; BE, beam expander (3×); CL, cylindrical lens; PBS, polarizing beam splitter; GV, 1-D galvo mirror; OBJ, objective lens; QWP, quarter-wave plate; TS, translational stage; P, polarizer. BS, beam splitter (50/50). The focal length of CL is 50 mm. Focal lengths of lenses L1, L2, L3, L4, L5 and L6 are 50, 50, 100, 40, 75 and 100 mm, respectively. The numerical aperture (NA) of the objective lens (4×) is 0.1.
-
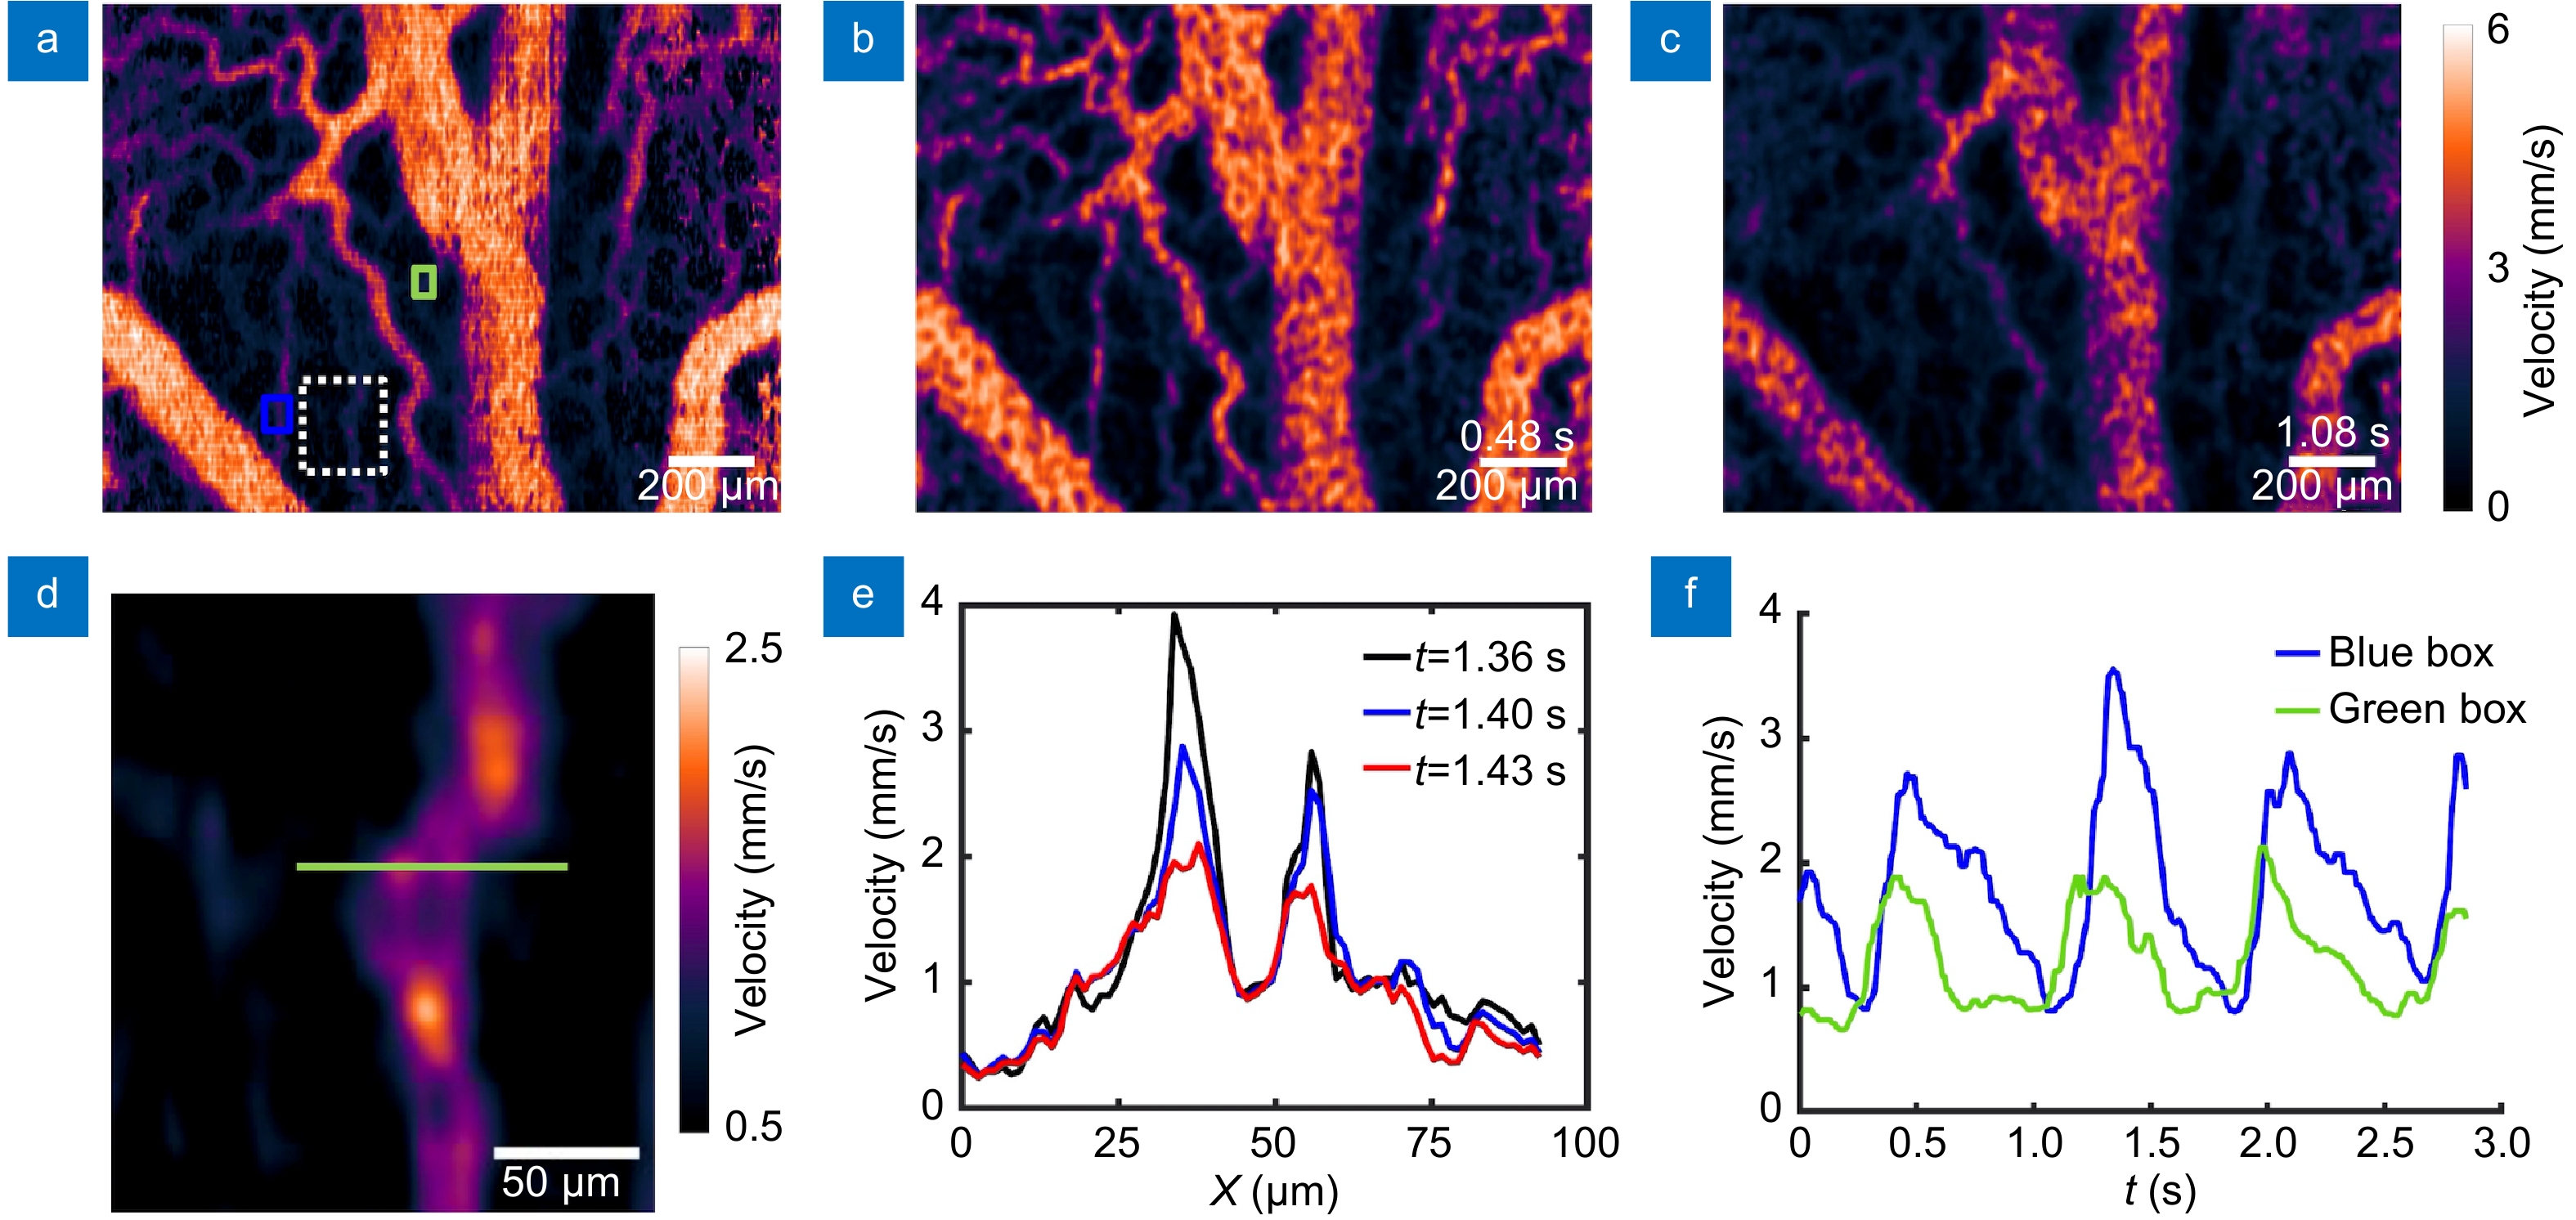
Figure 2.
Blood flow velocity images obtained from chicken embryo No. 1 using LS-LSAI. (a) An averaged blood flow velocity map over the entire image stack. (b) An instantaneous blood flow image at the time point 0.48 s, when the flow velocity reached the maximum. (c) An instantaneous blood flow image at the time point 1.08 s, when the flow velocity reached the minimum. (d) A magnified view of the white dashed boxed region in (a). (e) Cross-sectional flow velocity profiles taken along the green line in (d) at various time points. (f) The time courses of spatially averaged blood flow over the regions indicated by the blue and green squares in (a).
-
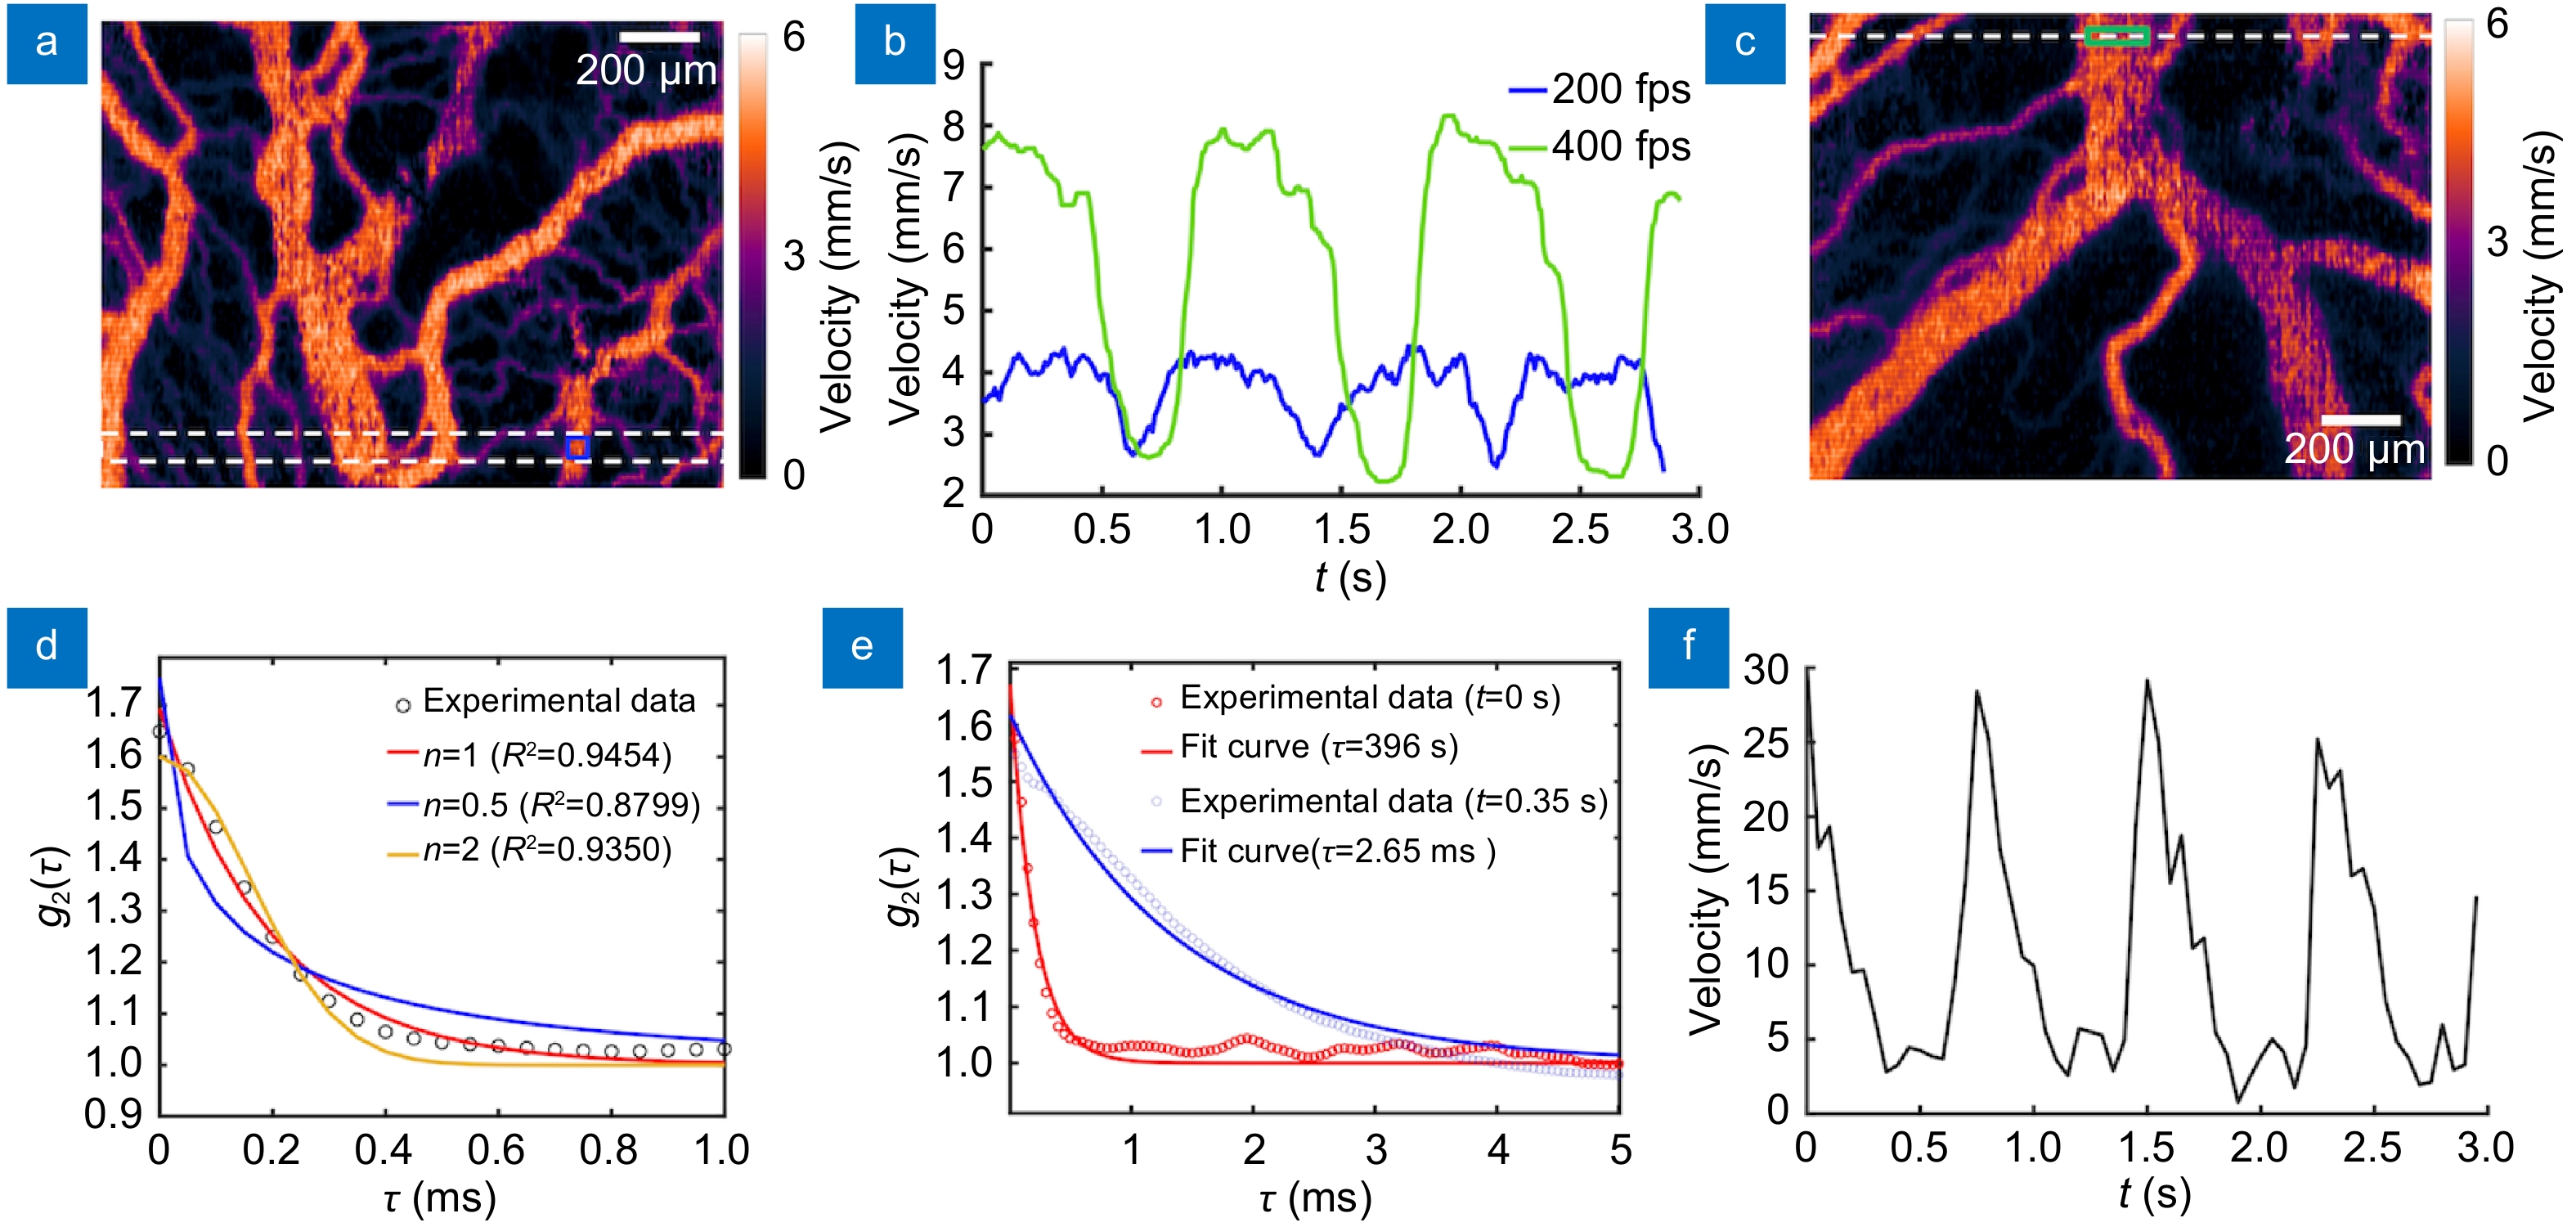
Figure 3.
LS-LSAI dynamic range and FOV. (a) A blood flow velocity image of a chicken embryo (No. 2) scanned at 200 fps for a standard FOV. (b) The comparison of time courses of the blood flow in the same regions [enclosed by the blue box in (a)]. Blue and green curves were related to the acquisition frame rate of 200 fps and 400 fps, respectively. (c) A time-averaged blood flow velocity image of another chicken embryo (No. 3) scanned at 200 fps. (d) The measured intensity temporal autocorrelation function (black circles), which was spatially averaged over a sampling region enclosed by the green box in (c) and fitted curves (solid lines) with models with different n. (e) The measured intensity temporal autocorrelation function at two different time points (circles), and their corresponding fitted curves (lines) with a model parameter n = 1. (f) The time course of the blood flow velocity for the same sampling region.
-
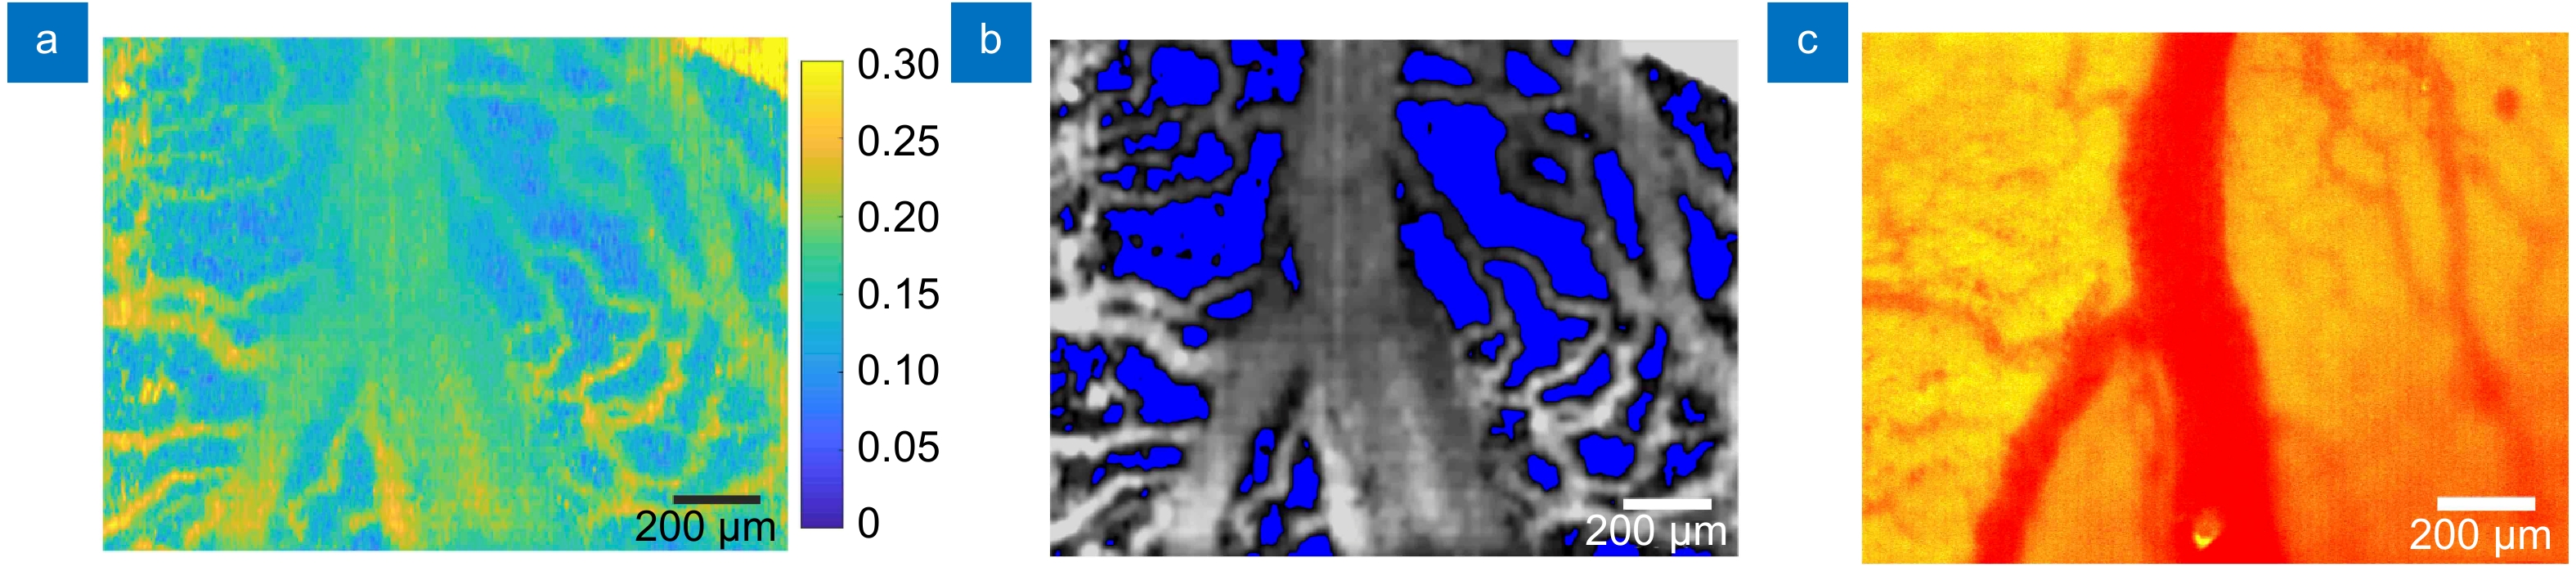
Figure 4.
Morphological information from the β map. (a) An averaged β map obtained from a chick embryo (No. 4). (b) The contrast-enhanced version of (a). (c) A wide-field color image of the vasculature in the same FOV with white light illumination.
-
Figure 5.
Comparison of LS-LSAI and LS-LSCI. The averaged velocity images (a) obtained with LS-LSCI with the exposure time of 24 ms and (b) LS-LSAI with the exposure time of 0.04 ms. (c) The flow velocity profiles taken along the white line in (a) and (b). (d) The spatially averaged blood flow velocity and standard deviation at the positions indicated by the white regions of interest (ROI) in (a) and (b).
-
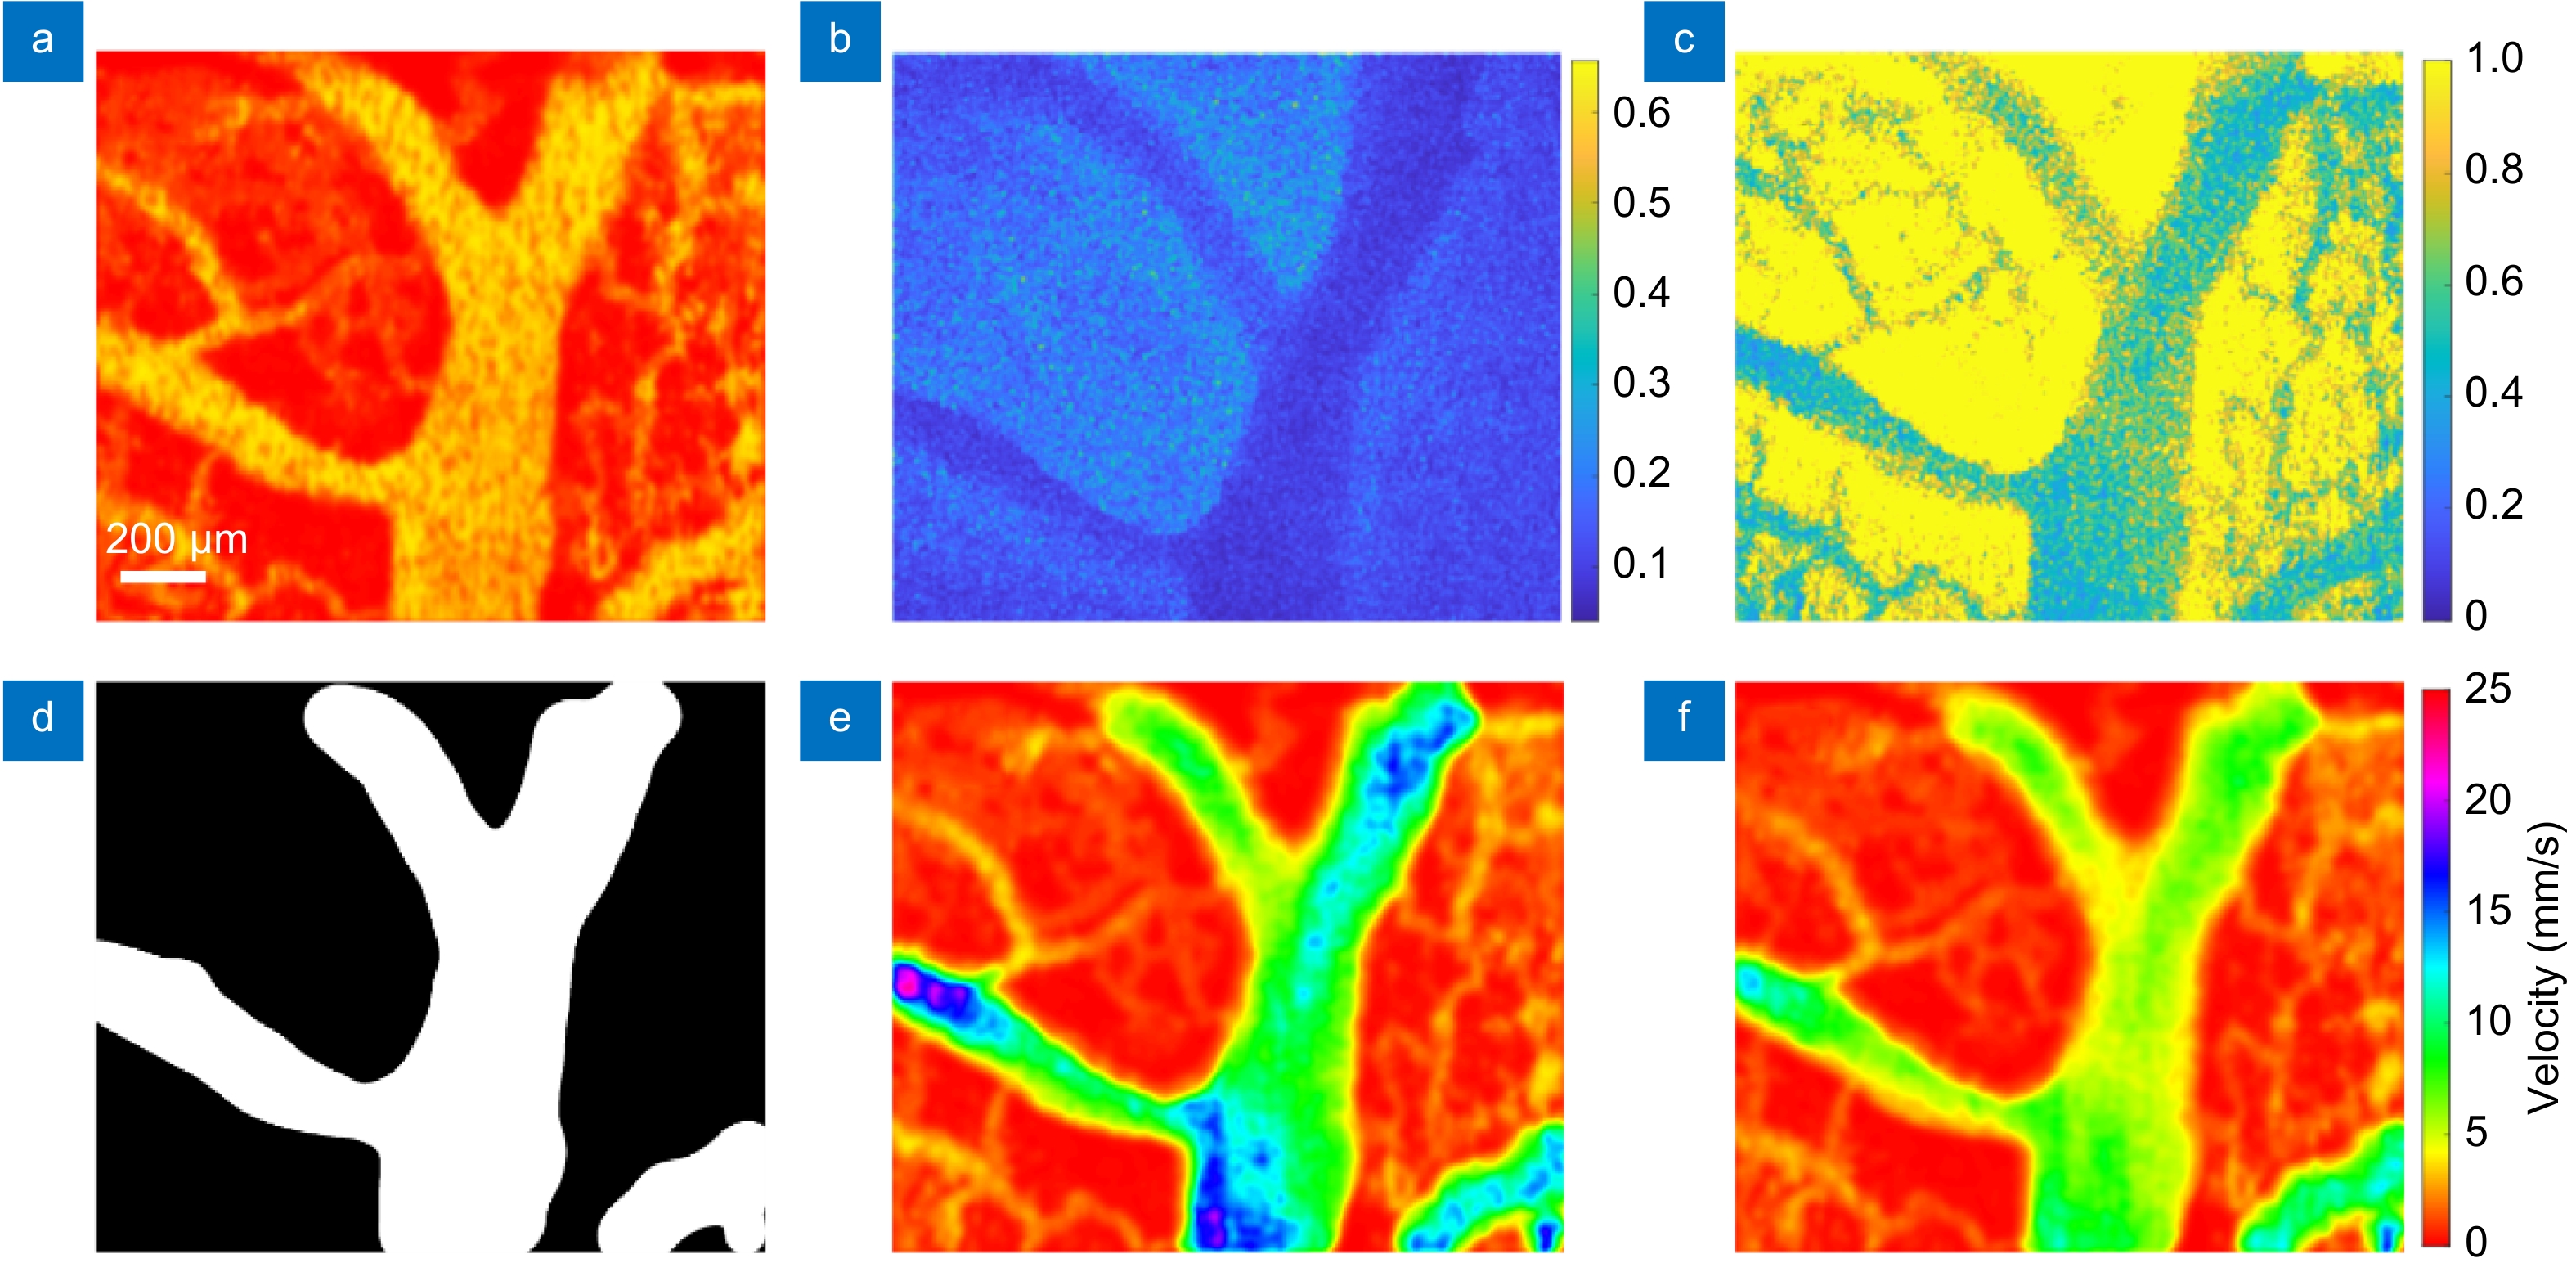
Figure 6.
LS-LSAI/SI-LSCI image fusion. (a) A LS-LSAI flow image. (b) The speckle contrast image of the same FOV acquired by SI-LSCI. (c) The normalized version of (b) with the β map from LS-LSAI. (d) A big vessel mask derived from (a). (e) and (f) Merged flow images at t=1 s and t=1.47 s, respectively. The same color map and color bar apply to (a), (e), and (f).


