
 E-mail Alert
 RSS
RSS
| Citation: |

|
Customized anterior segment photoacoustic imaging for ophthalmic burn evaluation in vivo
-
Abstract
Photoacoustic imaging has many advantages in ophthalmic application including high-resolution, requirement of no exogenous contrast agent, and noninvasive acquisition of both morphologic and functional information. However, due to the limited depth of focus of the imaging method and large curvature of the eye, it remains a challenge to obtain high quality vascular image of entire anterior segment. Here, we proposed a new method to achieve high quality imaging of anterior segment. The new method applied a curvature imaging strategy based on only one time scanning, and hence is time efficient and more suitable for ophthalmic imaging compared to previously reported methods using similar strategy. A custom-built photoacoustic imaging system was adapted for ophthalmic application and a customized image processing method was developed to quantitatively analyze both morphologic and functional information in vasculature of the anterior segment. The results showed that the new method improved the image quality of anterior segment significantly compared to that of conventional high resolution photoacoustic imaging. More importantly, we applied the new method to study ophthalmic disease in an in vivo mouse model for the first time. The results verified the suitability and advantages of the new method for imaging the entire anterior segment and the numerous potentials of applying it in ophthalmic imaging in future. -

-
References
[1] Tham YC, Li X, Wong TY, Quigley HA, Aung T et al. Global prevalence of glaucoma and projections of glaucoma burden through 2040: a systematic review and meta-analysis. Ophthalmology 121, 2081–2090 (2014). doi: 10.1016/j.ophtha.2014.05.013 [2] GBD 2015 Disease and Injury Incidence and Prevalence Collaborators. Global, regional, and national incidence, prevalence, and years lived with disability for 310 diseases and injuries, 1990–2015: a systematic analysis for the Global Burden of Disease Study 2015. Lancet 388, 1545–1602 (2016). doi: 10.1016/S0140-6736(16)31678-6 [3] Zhang Y, Li SZ, Li L, He MG, Thomas R et al. Dynamic iris changes as a risk factor in primary angle closure disease. Invest Ophthalmol Vis Sci 57, 218–226 (2016). doi: 10.1167/iovs.15-17651 [4] Yang HF, Yu PK, Cringle SJ, Sun XH, Yu DY. Quantitative study of the microvasculature and its endothelial cells in the porcine iris. Exp Eye Res 132, 249–258 (2015). doi: 10.1016/j.exer.2015.02.006 [5] Zhang Y, Li SZ, Li L, He MG, Thomas R et al. Quantitative analysis of iris changes after physiologic and pharmacologic mydriasis in a rural Chinese population. Invest Ophthalmol Vis Sci 55, 4405–4412 (2014). doi: 10.1167/iovs.13-13782 [6] Tan CS, Lim LW, Chow VS, Chay IW, Tan S et al. Optical coherence tomography angiography evaluation of the parafoveal vasculature and its relationship with ocular factors. Invest Ophthalmol Vis Sci 57, OCT224–OCT234 (2016). doi: 10.1167/iovs.15-18869 [7] Ghosh JG, Nguyen AA, Bigelow CE, Poor S, Qiu YB et al. Long-acting protein drugs for the treatment of ocular diseases. Nat Commun 8, 14837 (2017). doi: 10.1038/ncomms14837 [8] Dithmar S, Holz FG. Fluorescence Angiography in Ophthalmology (Springer, Berlin, 2008). [9] Skalet AH, Li Y, Lu CD, Jia Y, Lee B et al. Optical coherence tomography angiography characteristics of iris melanocytic tumors. Ophthalmology 124, 197–204 (2017). doi: 10.1016/j.ophtha.2016.10.003 [10] Ong SS, Cummings TJ, Vajzovic L, Mruthyunjaya P, Toth CA. Comparison of optical coherence tomography with fundus photographs, fluorescein angiography, and histopathologic analysis in assessing coats disease. JAMA Ophthalmol 137, 176–183 (2019). doi: 10.1001/jamaophthalmol.2018.5654 [11] Mahmoud H, Eladawi N, Elmogy M, Ghazal M, Alhalabi MT et al. Retinal diseases diagnosis based on optical coherence tomography angiography. In El-Baz AS, Suri JS. Diabetes and Fundus OCT (Elsevier, 2020); https://doi.org/10.1016/B978-0-12-817440-1.00006-1. [12] Pellegrini M, Acquistapace A, Oldani M, Cereda MG, Giani A et al. Dark atrophy: an optical coherence tomography angiography study. Ophthalmology 123, 1879–1886 (2016). doi: 10.1016/j.ophtha.2016.05.041 [13] Savastano MC, Lumbroso B, Rispoli M. In vivo characterization of retinal vascularization morphology using optical coherence tomography angiography. Retina 35, 2196–2203 (2015). doi: 10.1097/IAE.0000000000000635 [14] Choi WJ, Zhi ZW, Wang RK. In vivo OCT microangiography of rodent iris. Opt Lett 39, 2455–2458 (2014). doi: 10.1364/OL.39.002455 [15] Tian C, Zhang W, Mordovanakis A, Wang XD, Paulus YM. Noninvasive chorioretinal imaging in living rabbits using integrated photoacoustic microscopy and optical coherence tomography. Opt Express 25, 15947–15955 (2017). doi: 10.1364/OE.25.015947 [16] Zhang W, Li YX, Nguyen VP, Huang ZY, Liu ZP et al. High-resolution, in vivo multimodal photoacoustic microscopy, optical coherence tomography, and fluorescence microscopy imaging of rabbit retinal neovascularization. Light Sci Appl 7, 103 (2018). doi: 10.1038/s41377-018-0093-y [17] Lai PX, Wang LD, Tay JW, Wang LV. Photoacoustically guided wavefront shaping for enhanced optical focusing in scattering media. Nat Photonics 9, 126–132 (2015). doi: 10.1038/nphoton.2014.322 [18] Zhou YY, Cao F, Li HH, Huang XZ, Wei DS et al. Photoacoustic imaging of microenvironmental changes in facial cupping therapy. Biom Opt Express 11, 2394–2401 (2020). doi: 10.1364/BOE.387985 [19] Zhou YY, Liang SY, Li MS, Liu CB, Lai PX et al. Optical-resolution photoacoustic microscopy with ultrafast dual-wavelength excitation. J Biophotonics 13, e201960229 (2020). [20] Zhou YY, Chen JB, Liu C, Liu CB, Lai PX et al. Single-shot linear dichroism optical-resolution photoacoustic microscopy. Photoacoustics 16, 100148 (2019). doi: 10.1016/j.pacs.2019.100148 [21] Liu WZ, Schultz KM, Zhang K, Sasman A, Gao FL et al. In vivo corneal neovascularization imaging by optical-resolution photoacoustic microscopy. Photoacoustics 2, 81–86 (2014). doi: 10.1016/j.pacs.2014.04.003 [22] Liu WZ, Zhang HF. Photoacoustic imaging of the eye: a mini review. Photoacoustics 4, 112–123 (2016). doi: 10.1016/j.pacs.2016.05.001 [23] Zhao HX, Li K, Chen NB, Zhang KY, Wang LD et al. Multiscale vascular enhancement filter applied to in vivo morphologic and functional photoacoustic imaging of rat ocular vasculature. IEEE Photonics J 11, 3900912 (2019). [24] Wang LV, Hu S. Photoacoustic tomography: in vivo imaging from organelles to organs. Science 335, 1458–1462 (2012). doi: 10.1126/science.1216210 [25] Jeon S, Song HB, Kim J, Lee BJ, Managuli R et al. In vivo photoacoustic imaging of anterior ocular vasculature: a random sample consensus approach. Sci Rep 7, 4318 (2017). doi: 10.1038/s41598-017-04334-z [26] Raveendran S, Lim HT, Maekawa T, Matham MV, Kumar DS. Gold nanocages entering into the realm of high-contrast photoacoustic ocular imaging. Nanoscale 10, 13595–13968 (2018). [27] Wang LV, Yao JJ. A practical guide to photoacoustic tomography in the life sciences. Nat Methods 13, 627–638 (2016). doi: 10.1038/nmeth.3925 [28] Zhao HX, Wang GS, Lin RQ, Gong XJ, Song L et al. Three-dimensional Hessian matrix-based quantitative vascular imaging of rat iris with optical-resolution photoacoustic microscopy in vivo. J Biomed Opt 23, 046006 (2018). [29] Nguyen VP, Li YX, Zhang W, Wang XD, Paulus YM. High-resolution multimodal photoacoustic microscopy and optical coherence tomography image-guided laser induced branch retinal vein occlusion in living rabbits. Sci Rep 9, 10560 (2019). doi: 10.1038/s41598-019-47062-2 [30] Zhao HX, Chen NB, Li T, Zhang JH, Lin RQ et al. Motion correction in optical resolution photoacoustic microscopy. IEEE Trans Med Imaging 38, 2139–2150 (2019). doi: 10.1109/TMI.2019.2893021 [31] Zhao HX, Ke ZW, Chen NB, Wang SJ, Li K et al. A new deep learning method for image deblurring in optical microscopic systems. J Biophotonics 13, e201960147 (2020). [32] Lee SW, Kang H, Lee TG. Real-time display and in-vivo optical-resolution photoacoustic microscopy for ophthalmic imaging. Bioimaging 2, 34–38 (2017). [33] Wu N, Ye SQ, Ren QS, Li CH. High-resolution dual-modality photoacoustic ocular imaging. Opt Lett 39, 2451–2454 (2014). doi: 10.1364/OL.39.002451 [34] Yeh C, Soetikno BT, Hu S, Maslov KI, Wang LV. Microvascular quantification based on contour-scanning photoacoustic microscopy. J Biomed Opt 19, 096011 (2014). doi: 10.1117/1.JBO.19.9.096011 [35] Yeh C, Soetikno B, Hu S, Maslov KI, Wang LV. Three‐dimensional arbitrary trajectory scanning photoacoustic microscopy. J Biophotonics 8, 303–308 (2015). doi: 10.1002/jbio.201400055 [36] Zhou HC, Chen NB, Zhao HX, Yin TH, Zhang JH et al. Optical-resolution photoacoustic microscopy for monitoring vascular normalization during anti-angiogenic therapy. Photoacoustics 15, 100143 (2019). doi: 10.1016/j.pacs.2019.100143 [37] Fischler MA, Bolles RC. Random sample consensus: a paradigm for model fitting with applications to image analysis and automated cartography. Commun ACM 24, 381–395 (1981). doi: 10.1145/358669.358692 [38] Bullitt E, Gerig G, Pizer SM, Lin W, Aylward SR. Measuring tortuosity of the intracerebral vasculature from MRA images. IEEE Trans Med Imaging 22, 1163–1171 (2003). doi: 10.1109/TMI.2003.816964 [39] Parikh AH, Smith JK, Ewend MG, Bullitt E. Correlation of MR perfusion imaging and vessel tortuosity parameters in assessment of intracranial neoplasms. Technol Cancer Res Treat 3, 585–590 (2004). doi: 10.1177/153303460400300608 [40] Fung SSM, Stewart RMK, Dhallu SK, Sim DA, Keane PA et al. Anterior segment optical coherence tomographic angiography assessment of acute chemical injury. Am J Ophthalmol 205, 165–174 (2019). doi: 10.1016/j.ajo.2019.04.021 [41] Hu S, Rao B, Maslov K, Wang LV. Label-free photoacoustic ophthalmic angiography. Opt Lett 35, 1–3 (2010). doi: 10.1364/OL.35.000001 [42] Yao JJ, Wang LD, Yang JM, Maslov KI, Wong TTW et al. High-speed label-free functional photoacoustic microscopy of mouse brain in action. Nat Methods 12, 407–410 (2015). doi: 10.1038/nmeth.3336 [43] Zhang C, Zhao HX, Xu S, Chen NB, Li K et al. Multiscale high-speed photoacoustic microscopy based on free-space light transmission and a MEMS scanning mirror. Opt Lett 45, 4312–4315 (2020). [44] Guo JY, Wang T, Quan BG, Zhao H, Gu CZ et al. Polarization multiplexing for double images display. Opto-Electron Adv 2, 180029 (2019). doi: 10.29026/oea.2019.180029 [45] Zhang YB, Liu H, Cheng H, Tian JG, Chen SQ. Multidimensional manipulation of wave fields based on artificial microstructures. Opto-Electron Adv 3, 200002 (2020). doi: 10.29026/oea.2020.200002 -
Access History
Figures(7)
Article Metrics
Export File
Citation
Format
Content
 DownLoad:


-
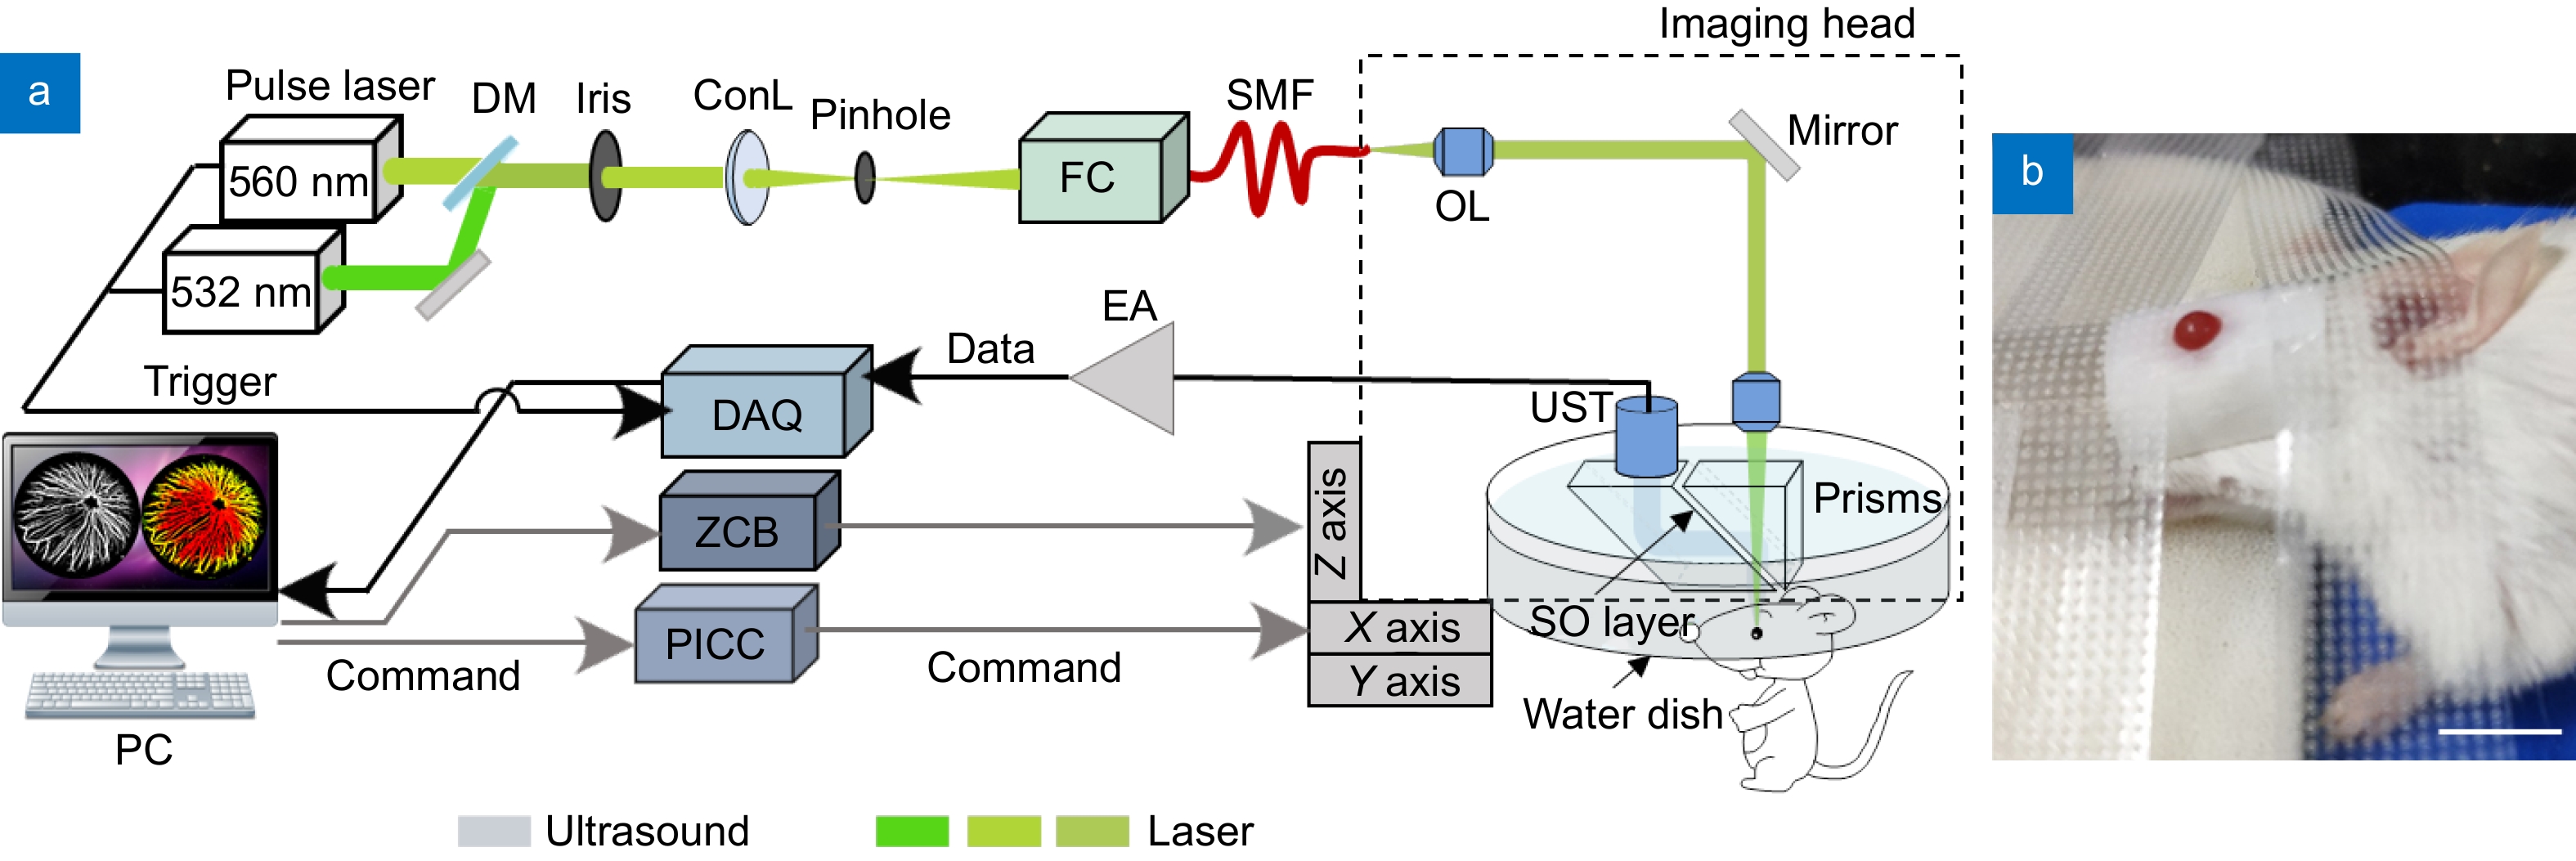
Figure 1.
(a) The ophthalmic photoacoustic microscopy developed in this study. DM, dichroic mirror; ConL, condenser lens; FC, fiber coupler; SMF, single-mode fiber; OL, objective lens; UST, ultrasonic transducer; SO, silicone oil; EA, electrical amplifier; DAQ, Adata acquisition; ZCB, Zolix control box; PICC, Physik Instrumente control card; PC, personal computer. (b) The physical map of a mouse during imaging; Scale bar=10 mm.
-
Figure 2.
(a) The flow chart of vascular morphologic information analysis. (b) The flow chart of vascular functional imaging; Scale bar=0.5 mm.
-
Figure 3.
(a−b) The optical microscopic images of a healthy eyeball before and after burn. (c) The HE staining result of the eyeball after photoacoustic imaging. Scale bar=0.2 mm.
-
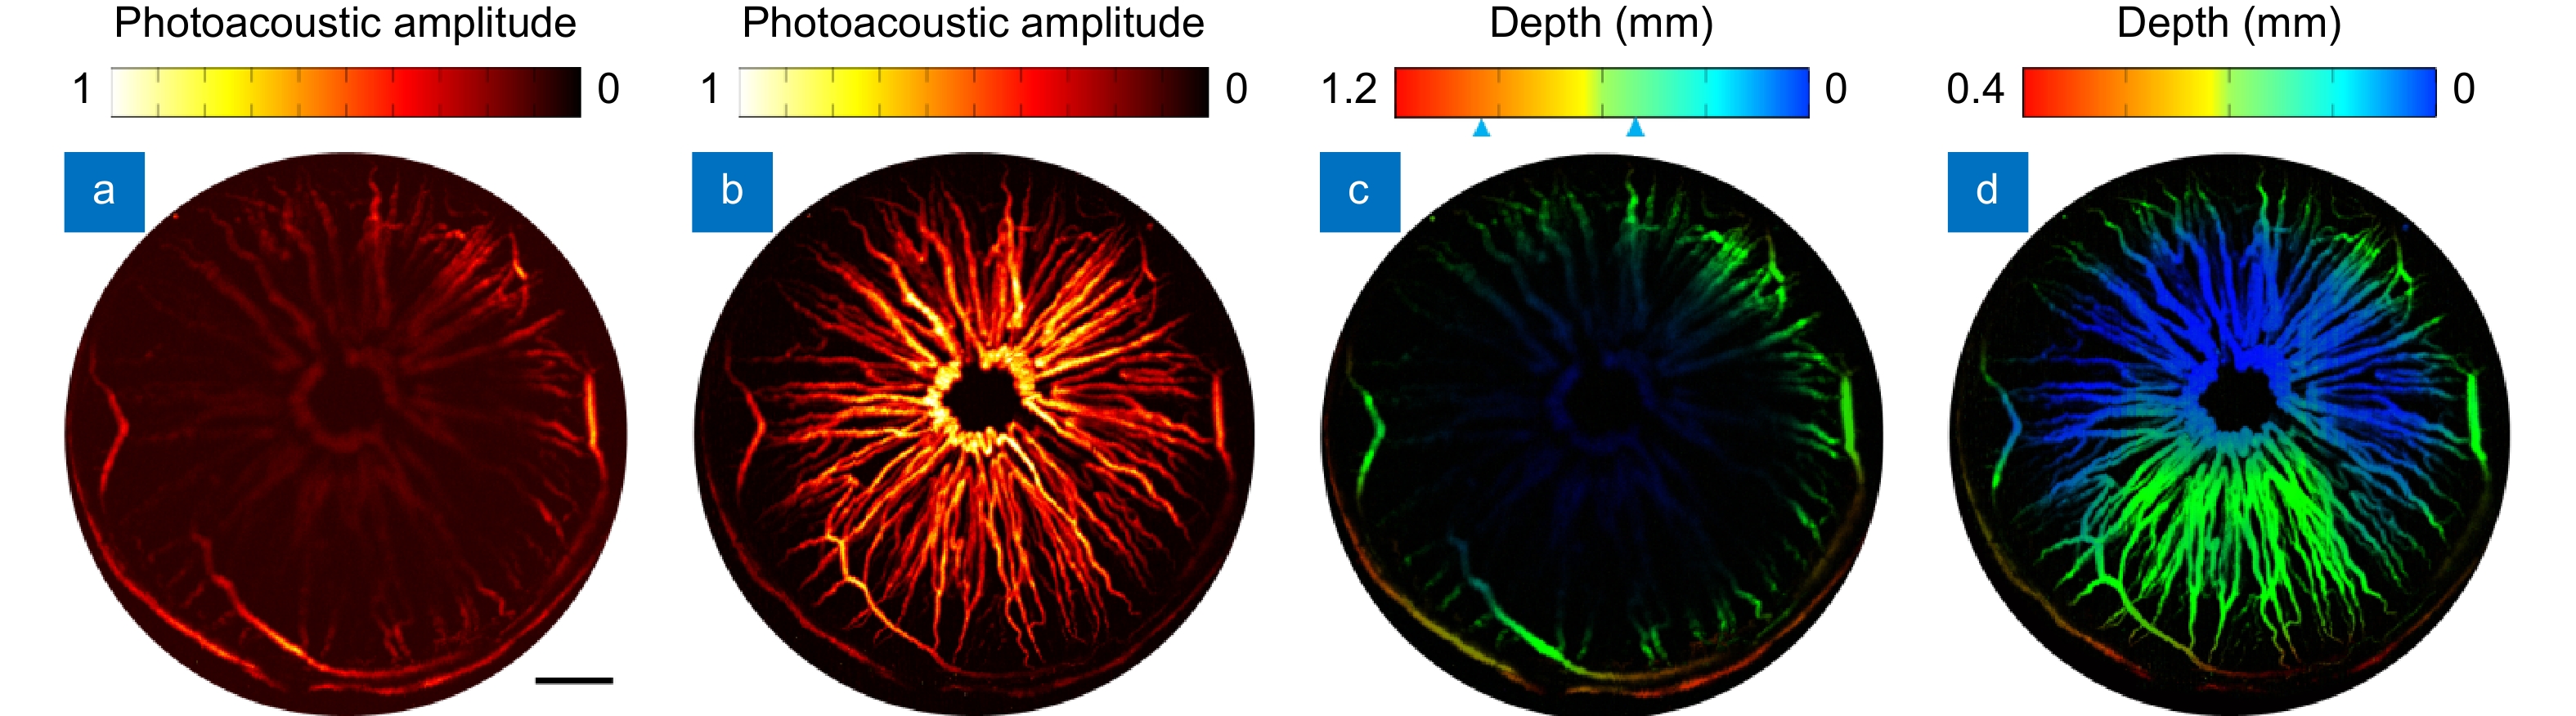
Figure 4.
(a−b) The MAP images of a representative mouse scanned by conventional OR-PAM and the new method developed in this study. (c−d). The depth encoded images of (a−b), respectively. Scale bar=0.5 mm.
-
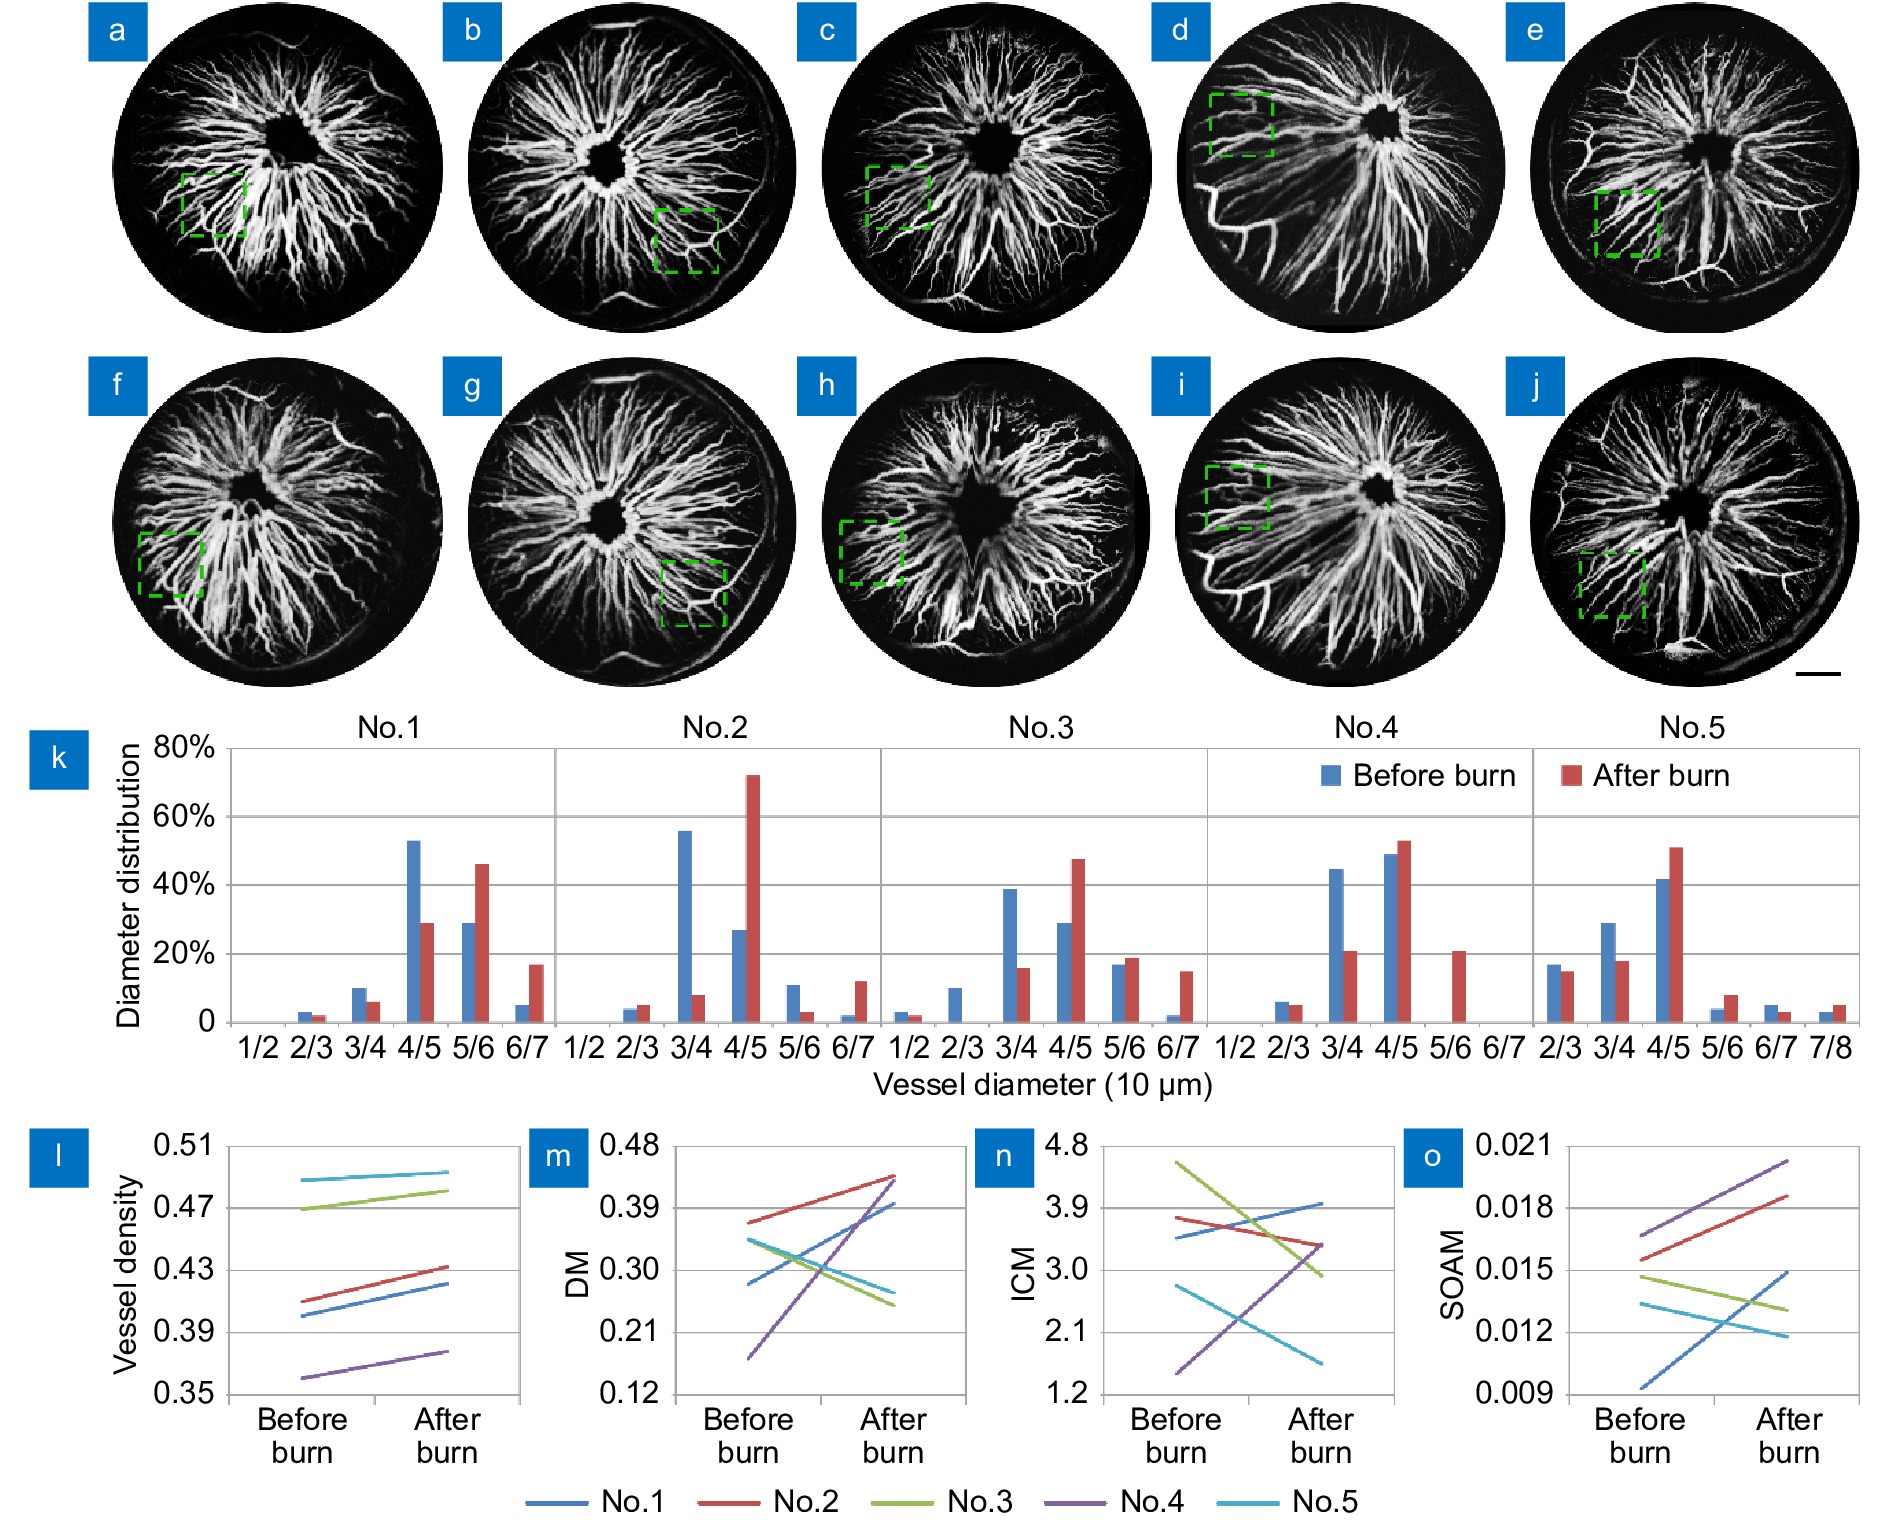
Figure 5.
(a−j) The MAP images of all mice before and after burn. (k−o) Quantitative analysis the vascular information of all mice, including vascular diameter (k), density (l) and tortuosity (m−o). Scale bar=0.5 mm.
-
Figure 6.
The sO2 maps of all mice before and after burn. Scale bar=0.5mm.
-
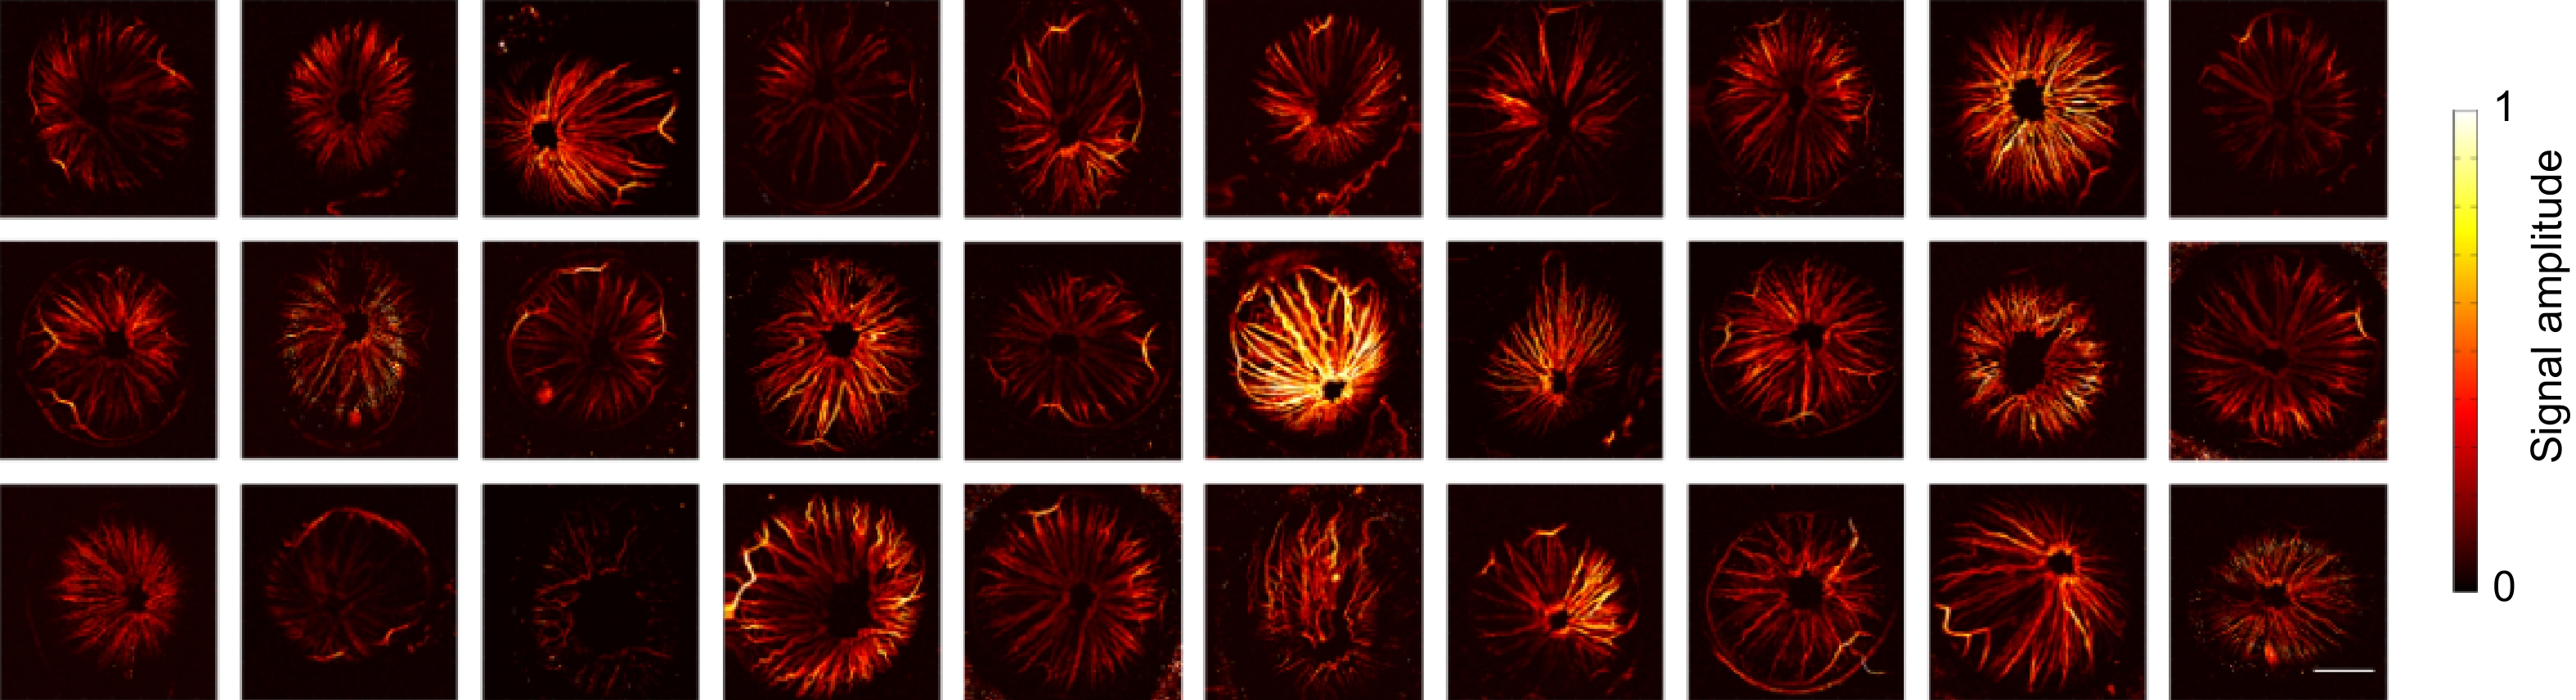
Figure A1.
Photoacoustic imaging results of iris in 30 mice. Scale bar=1 mm.


