
 E-mail Alert
 RSS
RSS
| Citation: |
Xie ZL, Meng C, Yue DH et al. Tip-enhanced Raman scattering of glucose molecules. Opto-Electron Sci 4, 240027 (2025). doi: 10.29026/oes.2025.240027

|
-
Abstract
Glucose molecules are of great significance being one of the most important molecules in metabolic chain. However, due to the small Raman scattering cross-section and weak/non-adsorption on bare metals, accurately obtaining their "fingerprint information" remains a huge obstacle. Herein, we developed a tip-enhanced Raman scattering (TERS) technique to address this challenge. Adopting an optical fiber radial vector mode internally illuminates the plasmonic fiber tip to effectively suppress the background noise while generating a strong electric-field enhanced tip hotspot. Furthermore, the tip hotspot approaching the glucose molecules was manipulated via the shear-force feedback to provide more freedom for selecting substrates. Consequently, our TERS technique achieves the visualization of all Raman modes of glucose molecules within spectral window of 400–3200 cm−1, which is not achievable through the far-field/surface-enhanced Raman, or the existing TERS techniques. Our TERS technique offers a powerful tool for accurately identifying Raman scattering of molecules, paving the way for biomolecular analysis. -

-
References
[1] Levy T, Voeltzke K, Hruby L et al. mTORC1 regulates cell survival under glucose starvation through 4EBP1/2-mediated translational reprogramming of fatty acid metabolism. Nat Commun 15, 4083 (2024). doi: 10.1038/s41467-024-48386-y [2] Prahalad P, Scheinker D, Desai M et al. Equitable implementation of a precision digital health program for glucose management in individuals with newly diagnosed type 1 diabetes. Nat Med 30, 2067–2075 (2024). doi: 10.1038/s41591-024-02975-y [3] Zou K, Rouskin S, Dervishi K et al. Life span extension by glucose restriction is abrogated by methionine supplementation: cross-talk between glucose and methionine and implication of methionine as a key regulator of life span. Sci Adv 6, eaba1306 (2020). doi: 10.1126/sciadv.aba1306 [4] Ibrahim MA, Allam M, El-Haes H et al. Analysis of the structure and vibrational spectra of glucose and fructose. Eclet Quim 31, 15–21 (2006). [5] Lewis BE, Schramm VL. Conformational equilibrium isotope effects in glucose by 13C NMR spectroscopy and computational studies. J Am Chem Soc 123, 1327–1336 (2001). doi: 10.1021/ja003291k [6] Zhang T, Li YT, Lv XM et al. Ultra-sensitive and unlabeled SERS nanosheets for specific identification of glucose in body fluids. Adv Funct Mater 34, 2315668 (2024). doi: 10.1002/adfm.202315668 [7] Yang D, Afroosheh S, Lee JO et al. Glucose sensing using surface-enhanced Raman-mode constraining. Anal Chem 90, 14269–14278 (2018). doi: 10.1021/acs.analchem.8b03420 [8] Ahmadianyazdi A, Lan Nguyen NH, Xu J et al. Glucose measurement via Raman spectroscopy of graphene: principles and operation. Nano Res 15, 8697–8704 (2022). doi: 10.1007/s12274-022-4587-9 [9] Sun XC. Glucose detection through surface-enhanced Raman spectroscopy: a review. Anal Chim Acta 1206, 339226 (2022). doi: 10.1016/j.aca.2021.339226 [10] Shafer-Peltier KE, Haynes CL, Glucksberg MR et al. Toward a glucose biosensor based on surface-enhanced Raman scattering. J Am Chem Soc 125, 588–593 (2003). doi: 10.1021/ja028255v [11] Sooraj KP, Ranjan M, Rao R et al. SERS based detection of glucose with lower concentration than blood glucose level using plasmonic nanoparticle arrays. Appl Surf Sci 447, 576–581 (2018). doi: 10.1016/j.apsusc.2018.04.020 [12] Shao MR, Ji C, Tan JB et al. Ferroelectrically modulate the Fermi level of graphene oxide to enhance SERS response. Opto-Electron Adv 6, 230094 (2023). doi: 10.29026/oea.2023.230094 [13] Wang WQ, Huang ZW. Stimulated Raman scattering microscopy with phase-controlled light focusing and aberration correction for rapid and label-free, volumetric deep tissue imaging. Opto-Electronic Adv 7, 240064 (2024). doi: 10.29026/oea.2024.240064 [14] Li SS, Fang YN, Wang JF. Control of light–matter interactions in two-dimensional materials with nanoparticle-on-mirror structures. Opto-Electron Sci 3, 240011 (2024). doi: 10.29026/oes.2024.240011 [15] Stuart DA, Yuen JM, Shah N et al. In vivo glucose measurement by surface-enhanced Raman spectroscopy. Anal Chem 78, 7211–7215 (2006). doi: 10.1021/ac061238u [16] Rycenga M, McLellan JM, Xia YN. A SERS study of the molecular structure of alkanethiol monolayers on Ag nanocubes in the presence of aqueous glucose. Chem Phys Lett 463, 166–171 (2008). doi: 10.1016/j.cplett.2008.08.062 [17] Ham J, Yun BJ, Koh WG. SERS-based biosensing platform using shape-coded hydrogel microparticles incorporating silver nanoparticles. Sens Actuators B Chem 341, 129989 (2021). doi: 10.1016/j.snb.2021.129989 [18] Meng QS, Zhang JX, Zhang Y et al. Local heating and Raman thermometry in a single molecule. Sci Adv 10, eadl1015 (2024). doi: 10.1126/sciadv.adl1015 [19] Imada H, Imai-Imada M, Miwa K et al. Single-molecule laser nanospectroscopy with micro-electron volt energy resolution. Science 373, 95–98 (2021). doi: 10.1126/science.abg8790 [20] Zhang R, Zhang Y, Dong ZC et al. Chemical mapping of a single molecule by plasmon-enhanced Raman scattering. Nature 498, 82–86 (2013). doi: 10.1038/nature12151 [21] Lee J, Crampton KT, Tallarida N et al. Visualizing vibrational normal modes of a single molecule with atomically confined light. Nature 568, 78–82 (2019). doi: 10.1038/s41586-019-1059-9 [22] Chen C, Li WZ, Song YC et al. Formation of water and glucose clusters by hydrogen bonds in glucose aqueous solutions. Comput Theor Chem 984, 85–92 (2012). doi: 10.1016/j.comptc.2012.01.013 [23] Deckert-Gaudig T, Kämmer E, Deckert V. Tracking of nanoscale structural variations on a single amyloid fibril with tip-enhanced Raman scattering. J Biophotonics 5, 215–219 (2012). doi: 10.1002/jbio.201100142 [24] Ma XZ, Zhu YZ, Yu N et al. Toward high-contrast atomic force microscopy-tip-enhanced Raman spectroscopy imaging: nanoantenna-mediated remote-excitation on sharp-tip silver nanowire probes. Nano Lett 19, 100–107 (2019). doi: 10.1021/acs.nanolett.8b03399 [25] Berweger S, Atkin JM, Olmon RL et al. Adiabatic tip-plasmon focusing for nano-Raman spectroscopy. J Phys Chem Lett 1, 3427–3432 (2010). doi: 10.1021/jz101289z [26] Zhang WD, Huang LG, Wei KY et al. High-order optical vortex generation in a few-mode fiber via cascaded acoustically driven vector mode conversion. Opt Lett 41, 5082–5085 (2016). doi: 10.1364/OL.41.005082 [27] Zhang WD, Huang LG, Wei KY et al. Cylindrical vector beam generation in fiber with mode selectivity and wavelength tunability over broadband by acoustic flexural wave. Opt Express 24, 10376–10384 (2016). doi: 10.1364/OE.24.010376 [28] Liu M, Lu FF, Zhang WD et al. Highly efficient plasmonic nanofocusing on a metallized fiber tip with internal illumination of the radial vector mode using an acousto-optic coupling approach. Nanophotonics 8, 921–929 (2019). doi: 10.1515/nanoph-2019-0027 [29] Lu FF, Zhang WD, Huang LG et al. Mode evolution and nanofocusing of grating-coupled surface plasmon polaritons on metallic tip. Opto-Electron Adv 1, 180010 (2018). [30] Oskooi AF, Roundy D, Ibanescu M et al. MEEP: a flexible free-software package for electromagnetic simulations by the FDTD method. Comput Phys Commun 181, 687–702 (2010). doi: 10.1016/j.cpc.2009.11.008 [31] Haynes WM. CRC Handbook of Chemistry and Physics (CRC Press, Boca Raton, 2016). [32] Palik ED. Handbook of Optical Constants of Solids (Academic Press, Orlando, 1985). [33] Karrai K, Grober RD. Piezoelectric tip-sample distance control for near field optical microscopes. Appl Phys Lett 66, 1842–1844 (1995). doi: 10.1063/1.113340 [34] Wang X, Zhang AH, Zhi MC et al. Glucose concentration measured by the hybrid coherent anti-Stokes Raman-scattering technique. Phys Rev A 81, 013813 (2010). doi: 10.1103/PhysRevA.81.013813 [35] Kang JW, Park YS, Chang H et al. Direct observation of glucose fingerprint using in vivo Raman spectroscopy. Sci Adv 6, eaay5206 (2020). doi: 10.1126/sciadv.aay5206 [36] Hariharan PC, Pople JA. Accuracy of AHn equilibrium geometries by single determinant molecular orbital theory. Mol Phys 27, 209–214 (1974). doi: 10.1080/00268977400100171 [37] Lu T, Chen FW. Multiwfn: a multifunctional wavefunction analyzer. J Comput Chem 33, 580–592 (2012). doi: 10.1002/jcc.22885 [38] Kobayashi K, Unno H, Takizawa H et al. Chemical treatment effect of Si (111) surfaces in H2SO4: H2O2 solution. Jpn J Appl Phys 35, 5925–5928 (1996). doi: 10.1143/JJAP.35.5925 -
Supplementary Information
Supplementary information for Tip-enhanced Raman scattering of glucose molecules 
-
Access History
Figures(4)
Article Metrics

Export File
Citation
Xie ZL, Meng C, Yue DH et al. Tip-enhanced Raman scattering of glucose molecules. Opto-Electron Sci 4, 240027 (2025). doi: 10.29026/oes.2025.240027
Format
Content
 DownLoad:
-
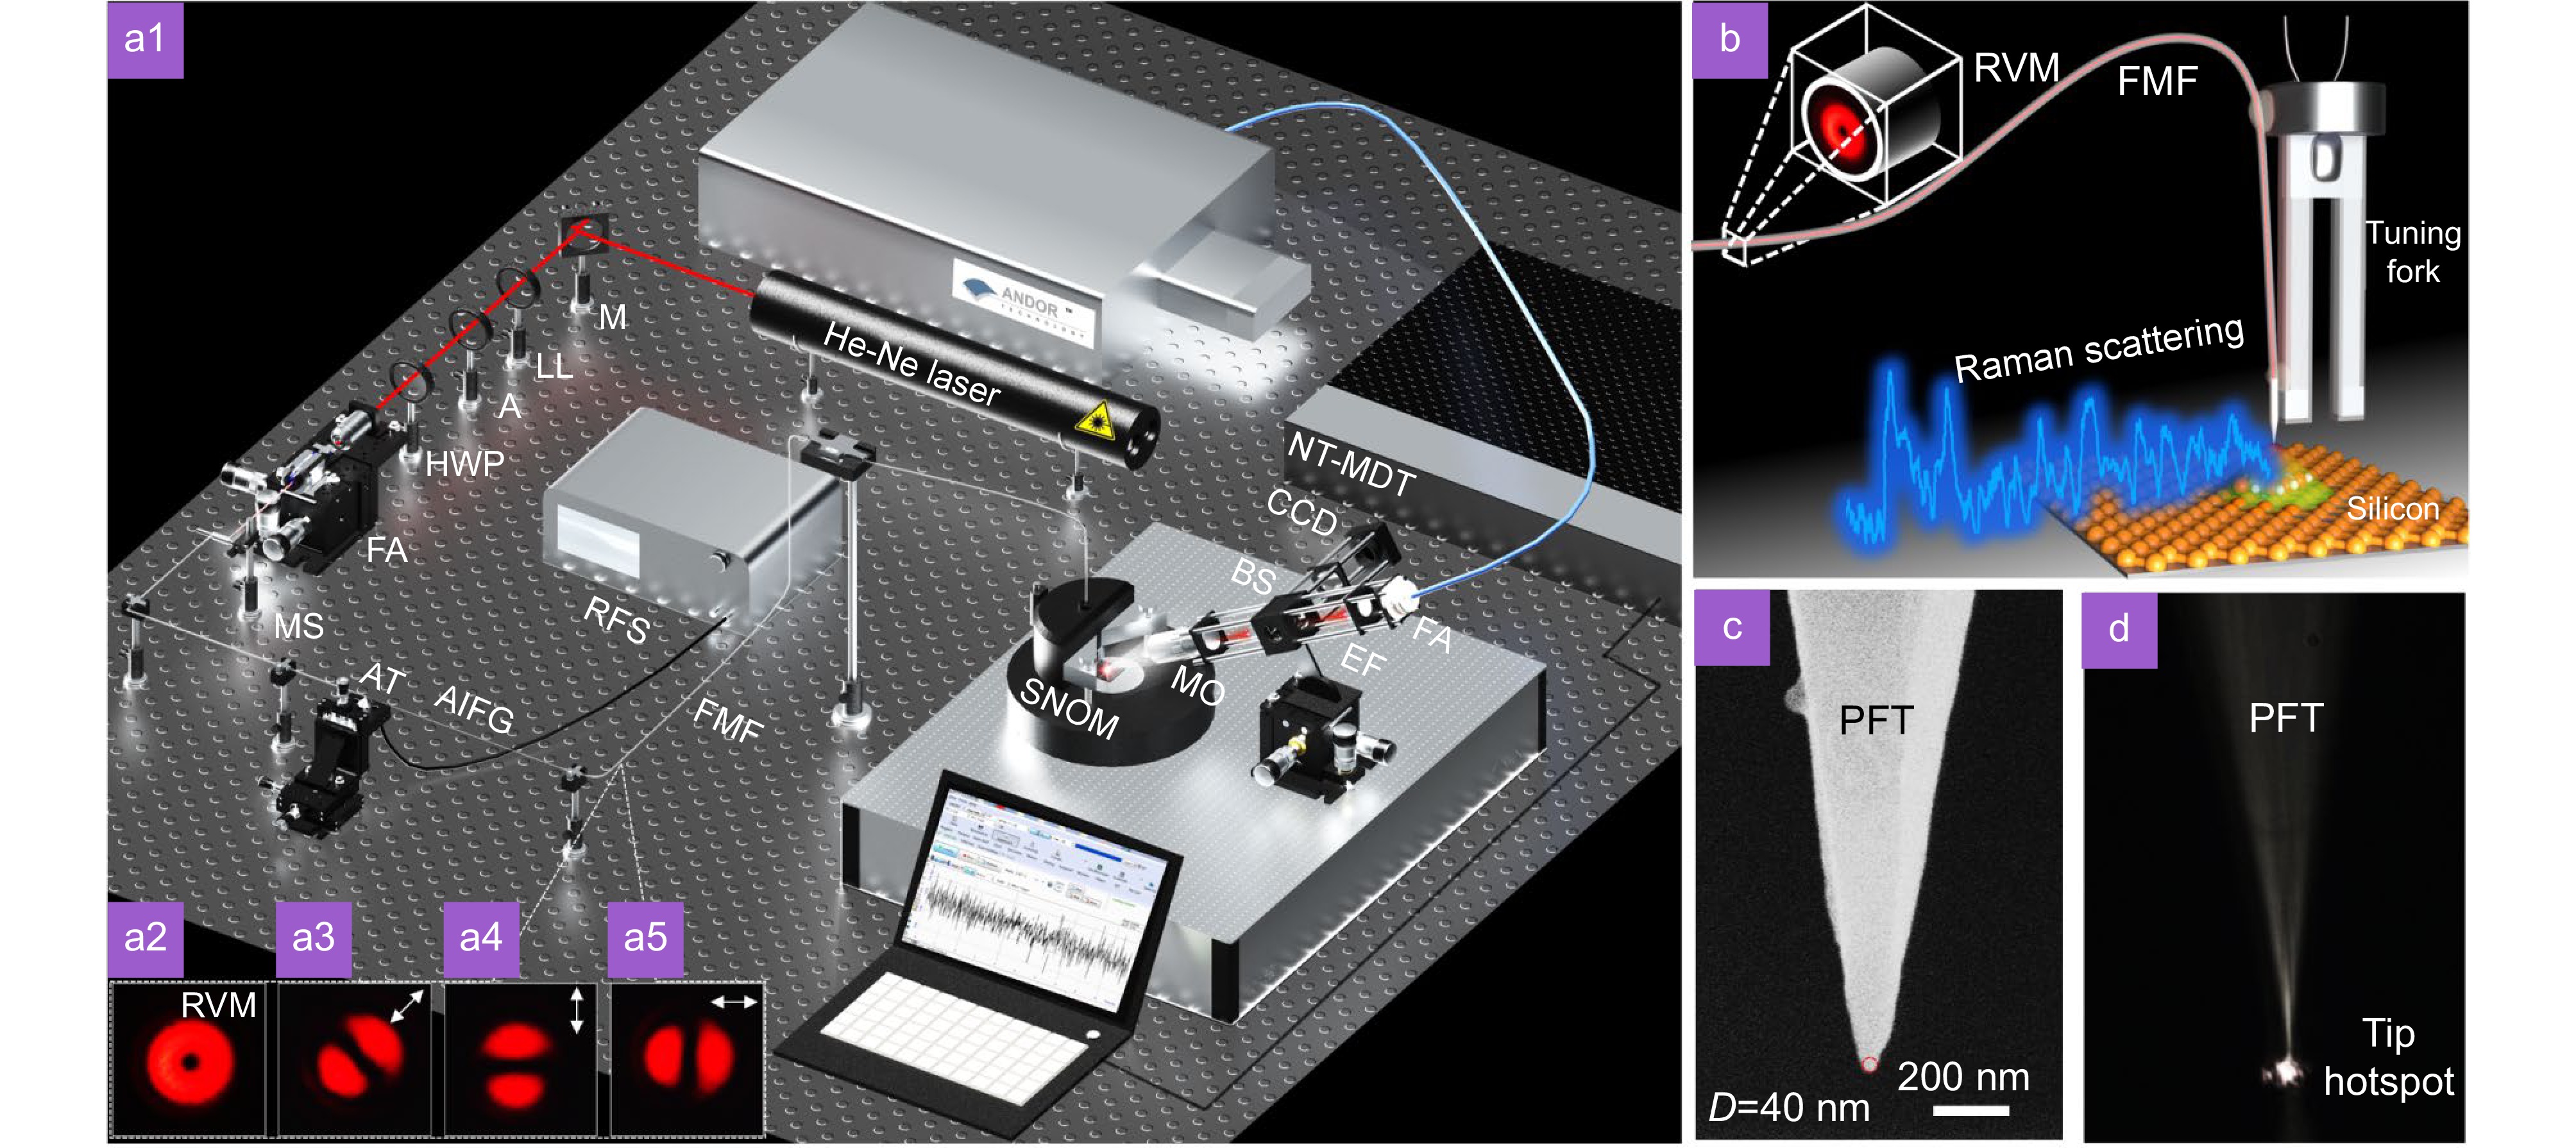
Figure 1.
Principle of SNOM-TERS. (a1) Sketch map of SNOM-TERS platform. M: mirror, LL: laser line, A: attenuator, HWP: half-wave plate. Insets show the transverse mode intensity of fiber RVM (a2) and the corresponding transverse electric vector distribution examinations (a3–a5). (b) PFT bunded on the tuning fork to approach silicon substrate. (c) SEM image of PFT with a tip curvature radius of 20 nm. (d) Photograph of PFT achieving background-free tip hotspot with the fiber RVM internal illumination.
-
Figure 2.
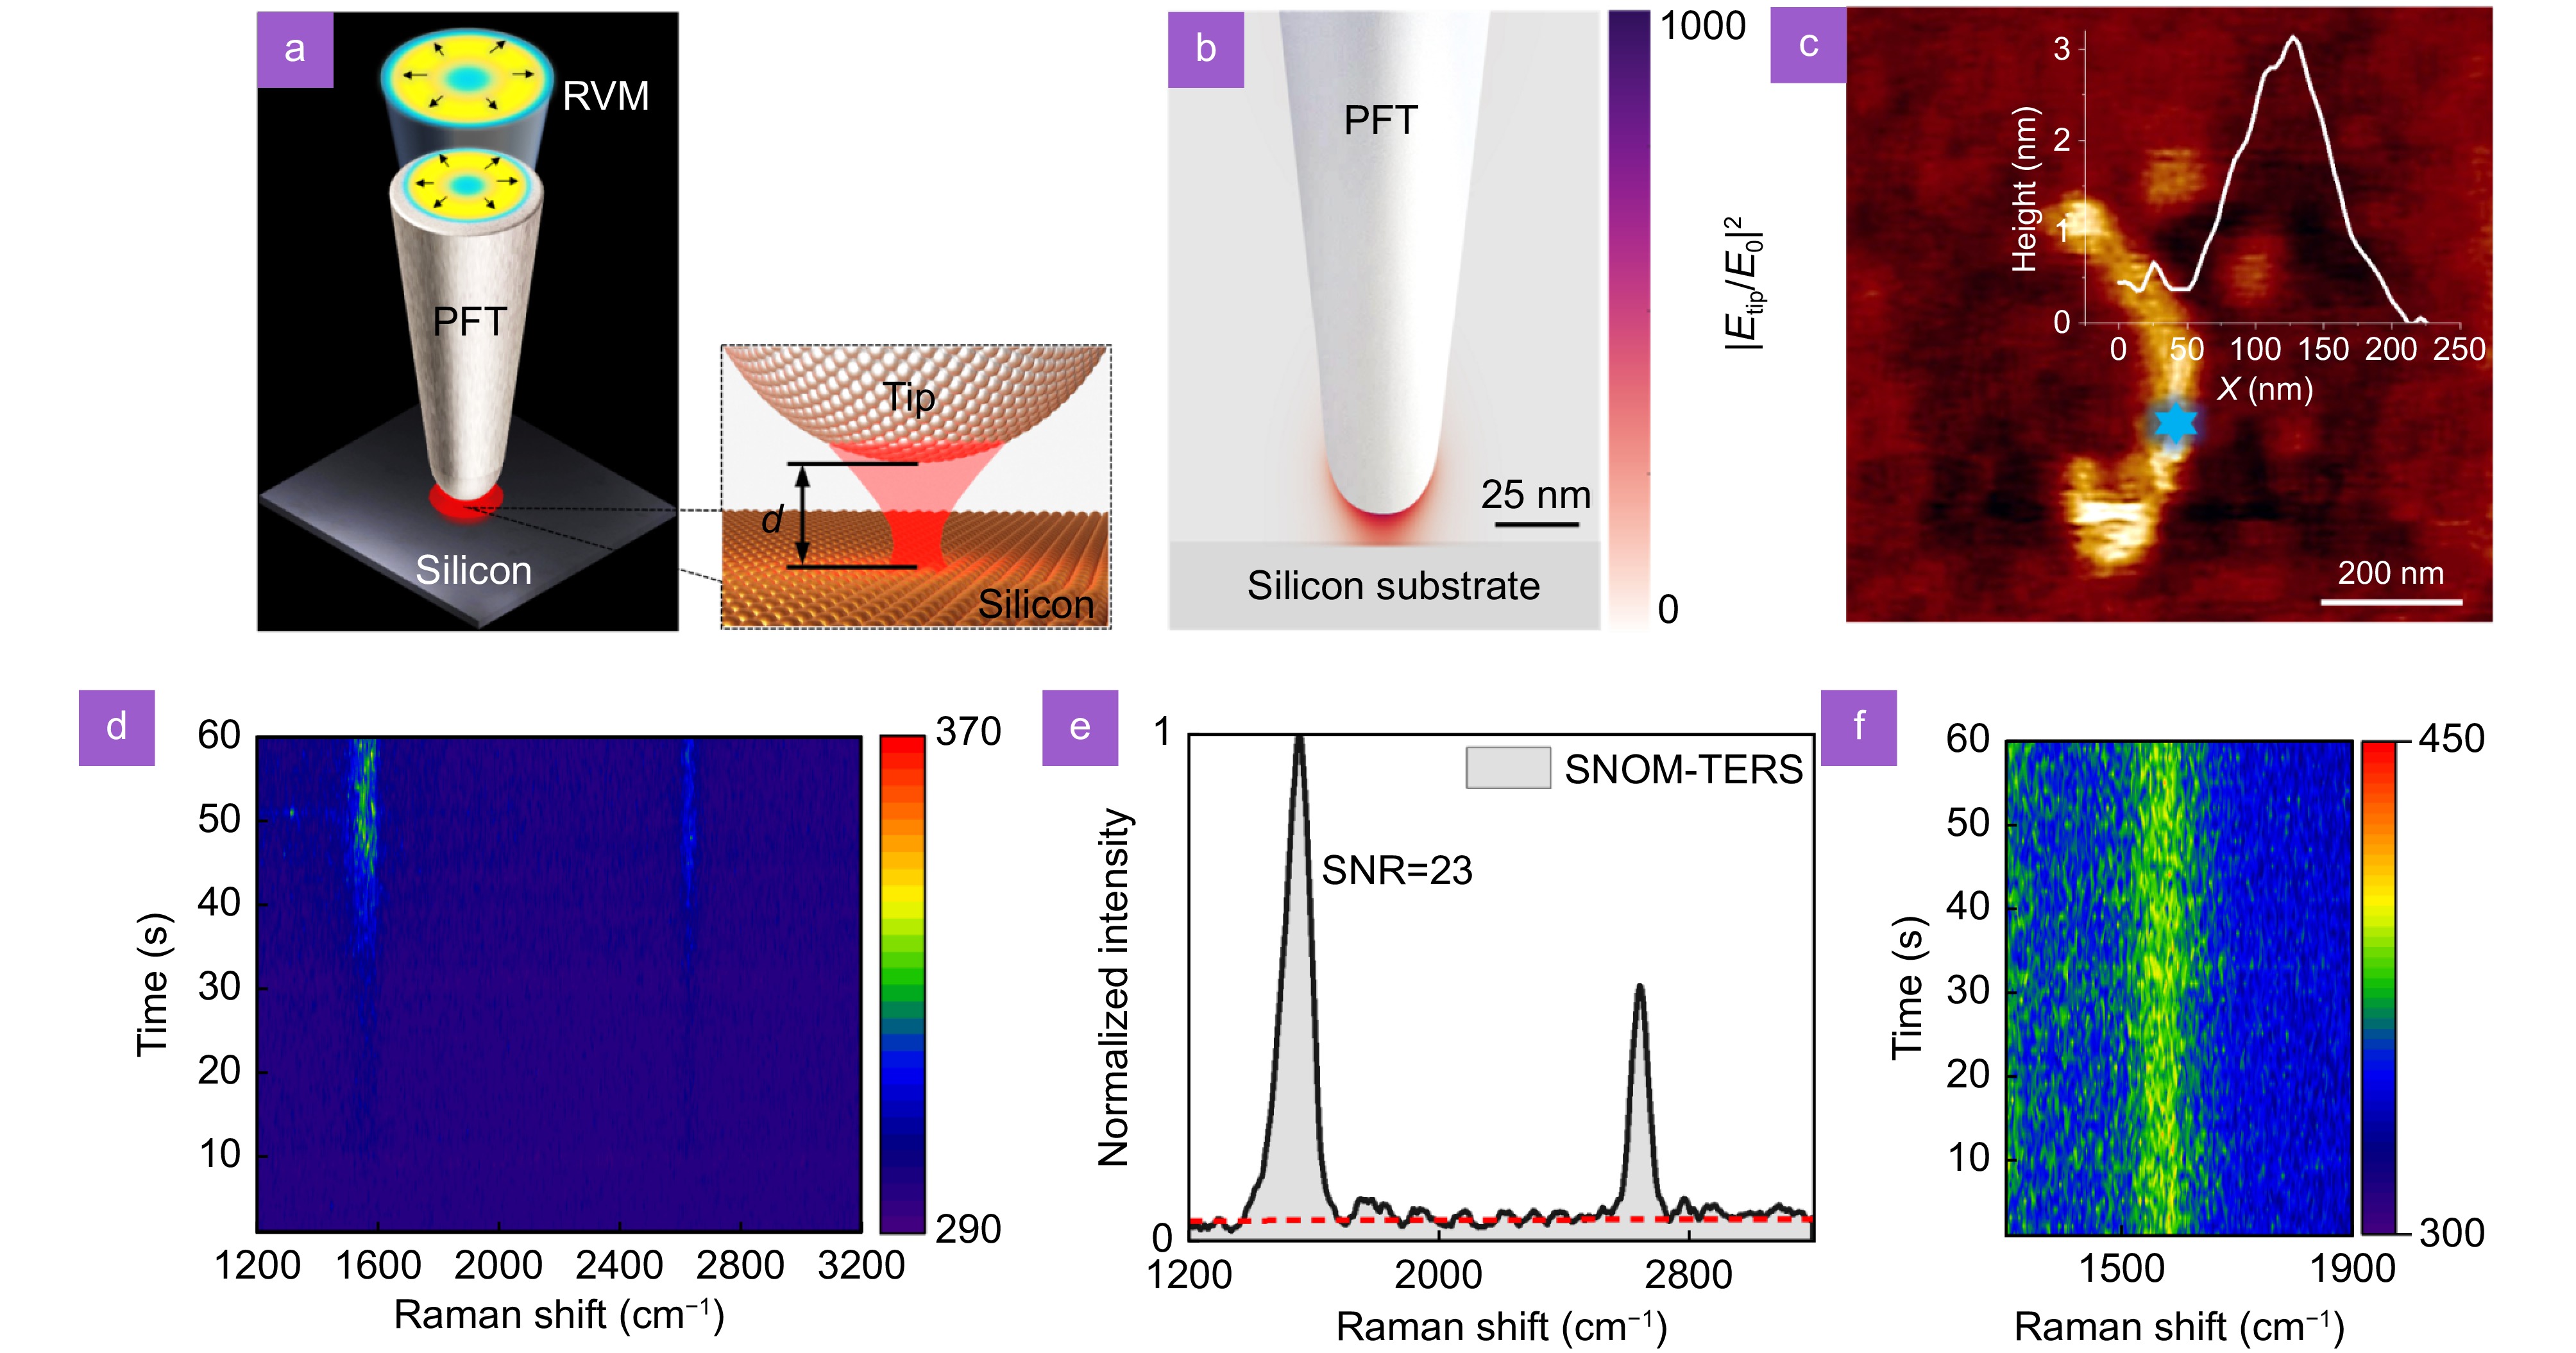
Performance evaluation of SNOM-TERS platform. (a) Illustrations of the background-free tip hotspot approaching silicon substrate with tip-substrate distance of d. (b) Calculated electric-field intensity enhancement factor |Etip/E0|2 of tip hotspot in the case of d=10 nm and λ=632.8 nm, with Etip and E0 being of electric field of tip hotspot and fiber RVM, respectively. (c) Shear-force topography of SWCNT dispersed on a silicon substrate and (d) the corresponding time-series of SNOM-TERS spectra of SWCNT with excitation power increasing from 0 mW to 0.12 mW. Star symbol indicated the position of tip hotspot, and integration time of spectrometer was 1 s. (e) Normalized SNOM-TERS spectrum of SWNT obtained from (d) at t=55 s. (f) Time-series of SNOM-TERS spectra of SWCNT with excitation power of 0.2 mW.
-
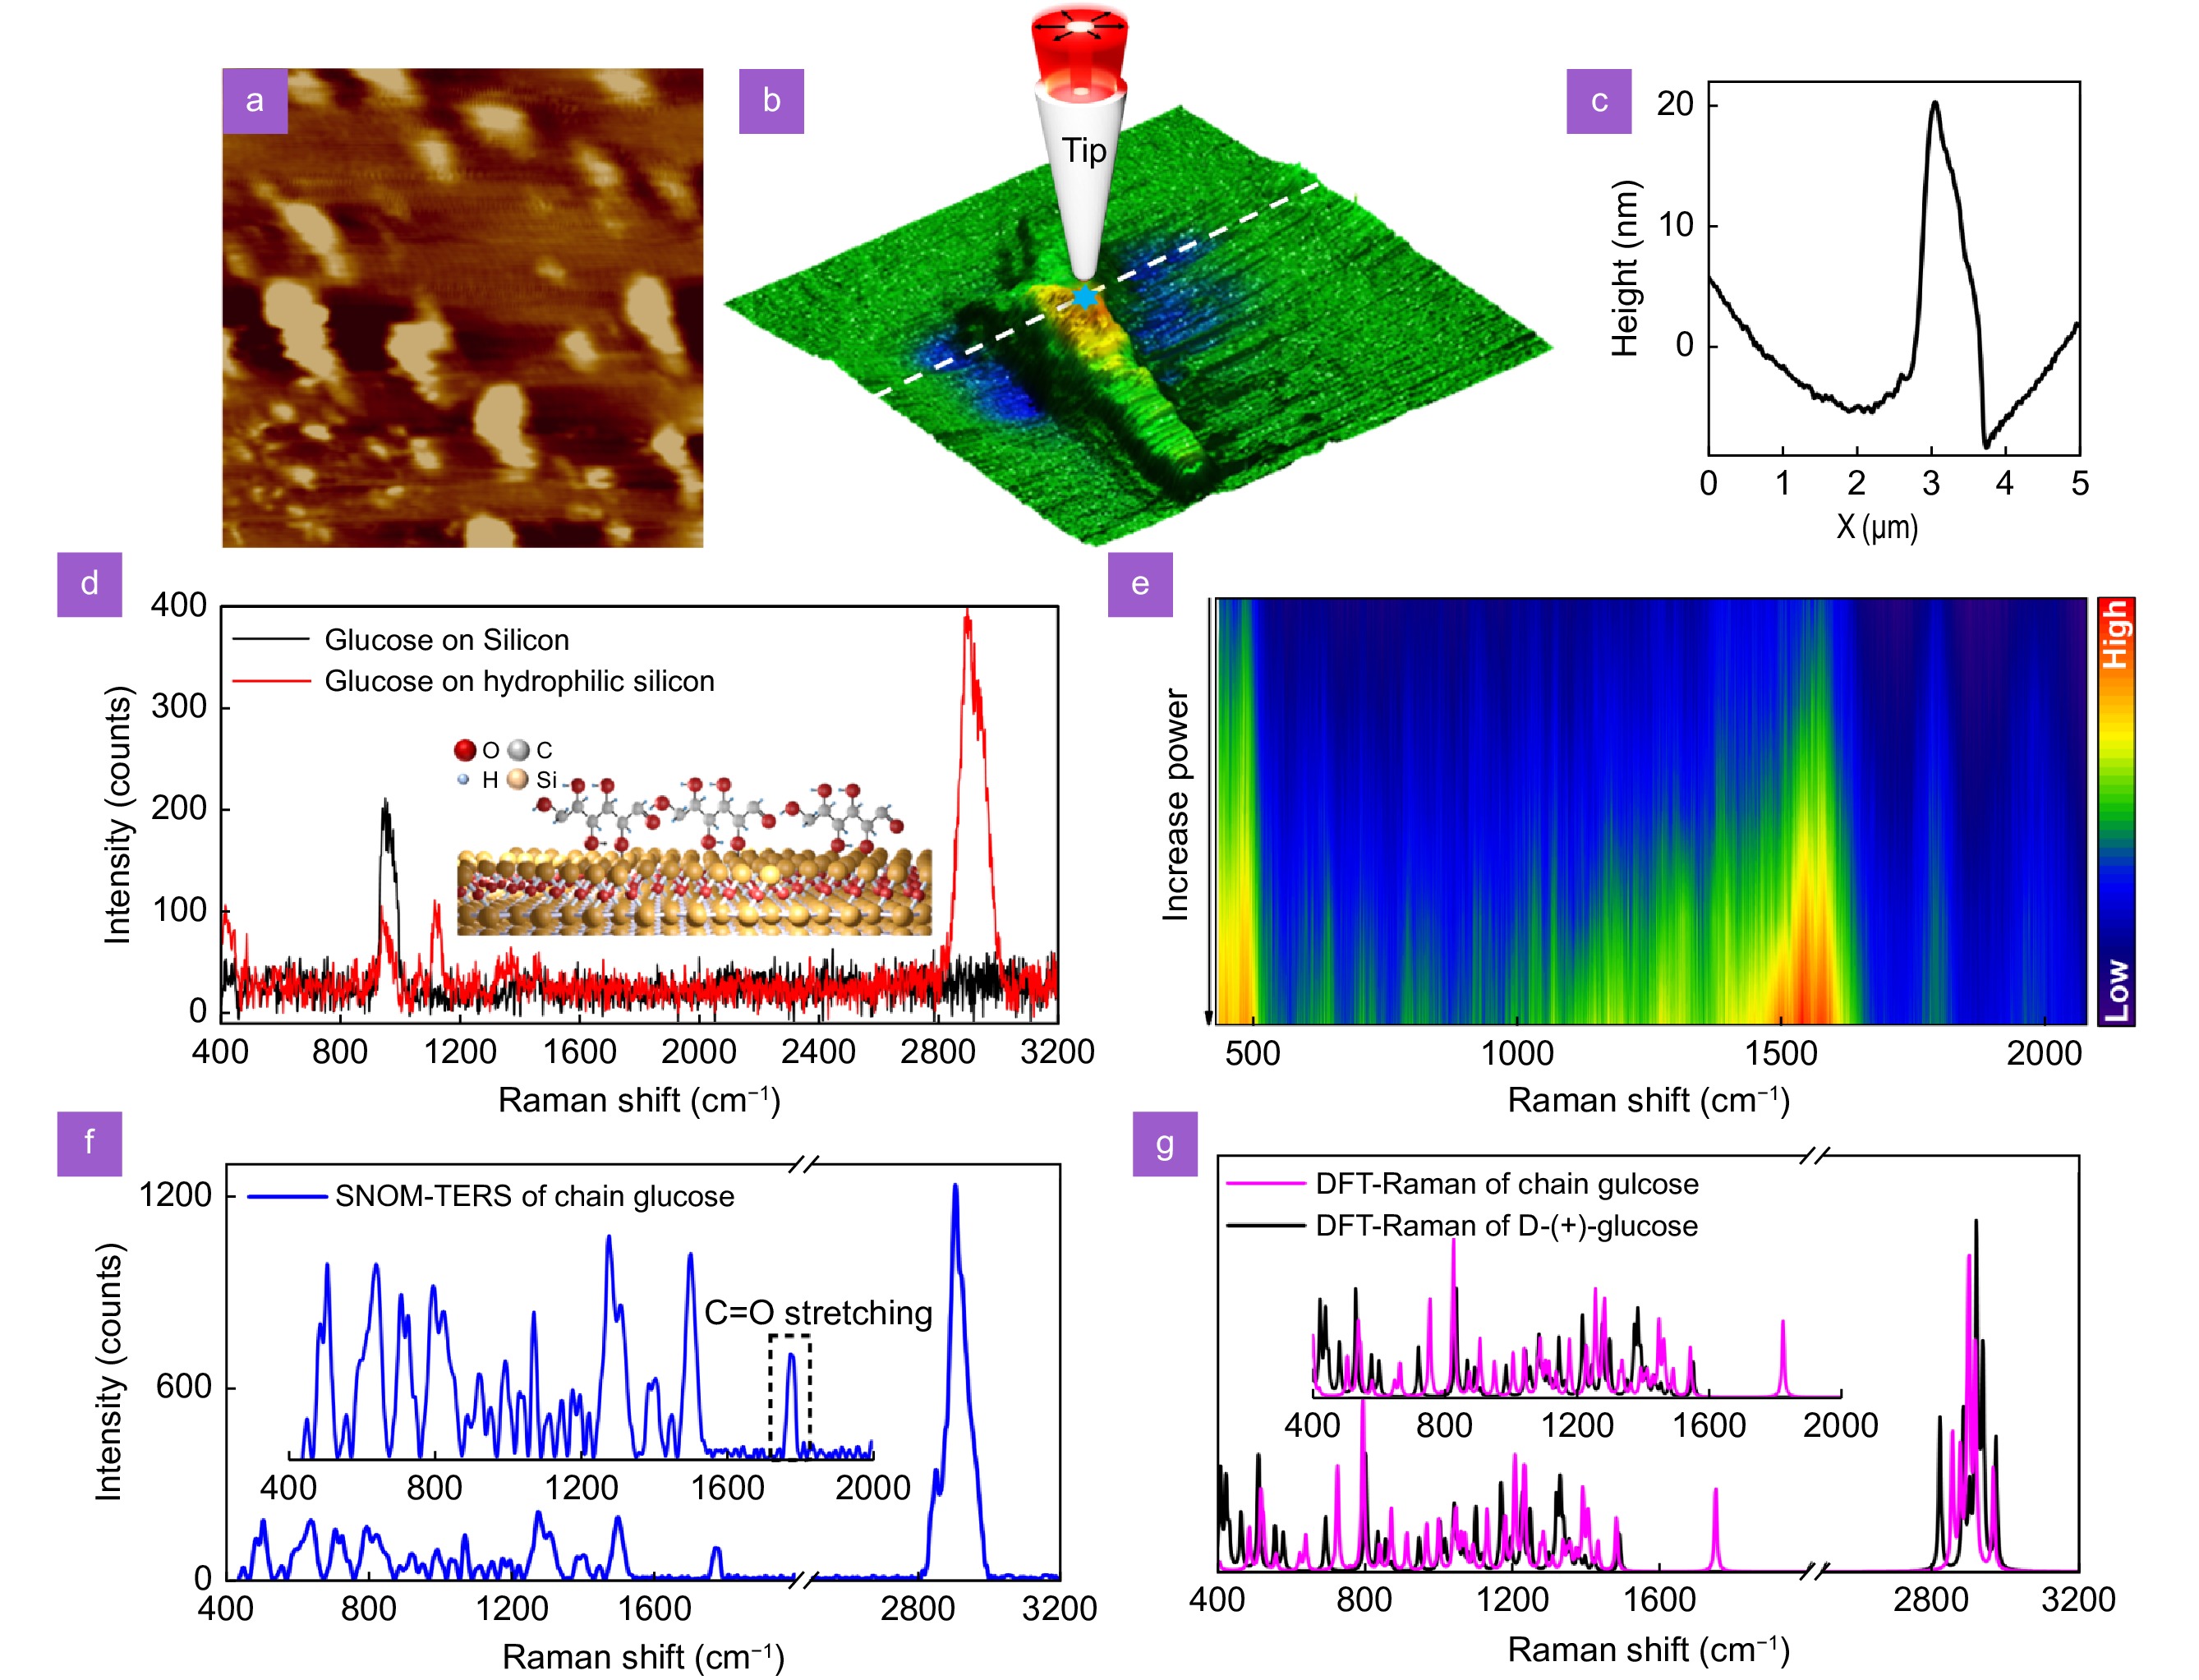
Figure 3.
Fingerprint information acquisition of glucose molecules. (a) Shear-force topography (15 μm×15 μm) of glucose molecules clustered on a hydrophilic silicon substrate and (b) a typical three-dimensional morphology distribution (5 μm×5 μm). (c) Height distribution of glucose molecule cluster obtained along a dashed white line in (b). (d) Far-filed Raman spectra of glucose molecules clustered on silicon (black curve) and hydrophilic silicon (red curve) substrates. Inset is an illustration of glucose molecules adsorbed efficiently on hydrophilic silicon, and the integration time of spectrometer was 20 s. (e) Time-series of SNOM-TERS spectra of glucose molecular cluster with excitation power increasing from 0.1 mW to 0.25 mW, and the integration time of spectrometer was 120 s. (f) SNOM-TERS spectrum with PFT approaching glucose molecules cluster and locating at the position indicated by star symbol in (b). Excitation power was 0.25 mW, and integration time of spectrometer was 120 s. (g) DFT-calculated Raman spectra of chain and D-(+)-glucose molecules (Method 1) with chemical structures of two types of glucose molecules being shown in
Fig. S10 . -
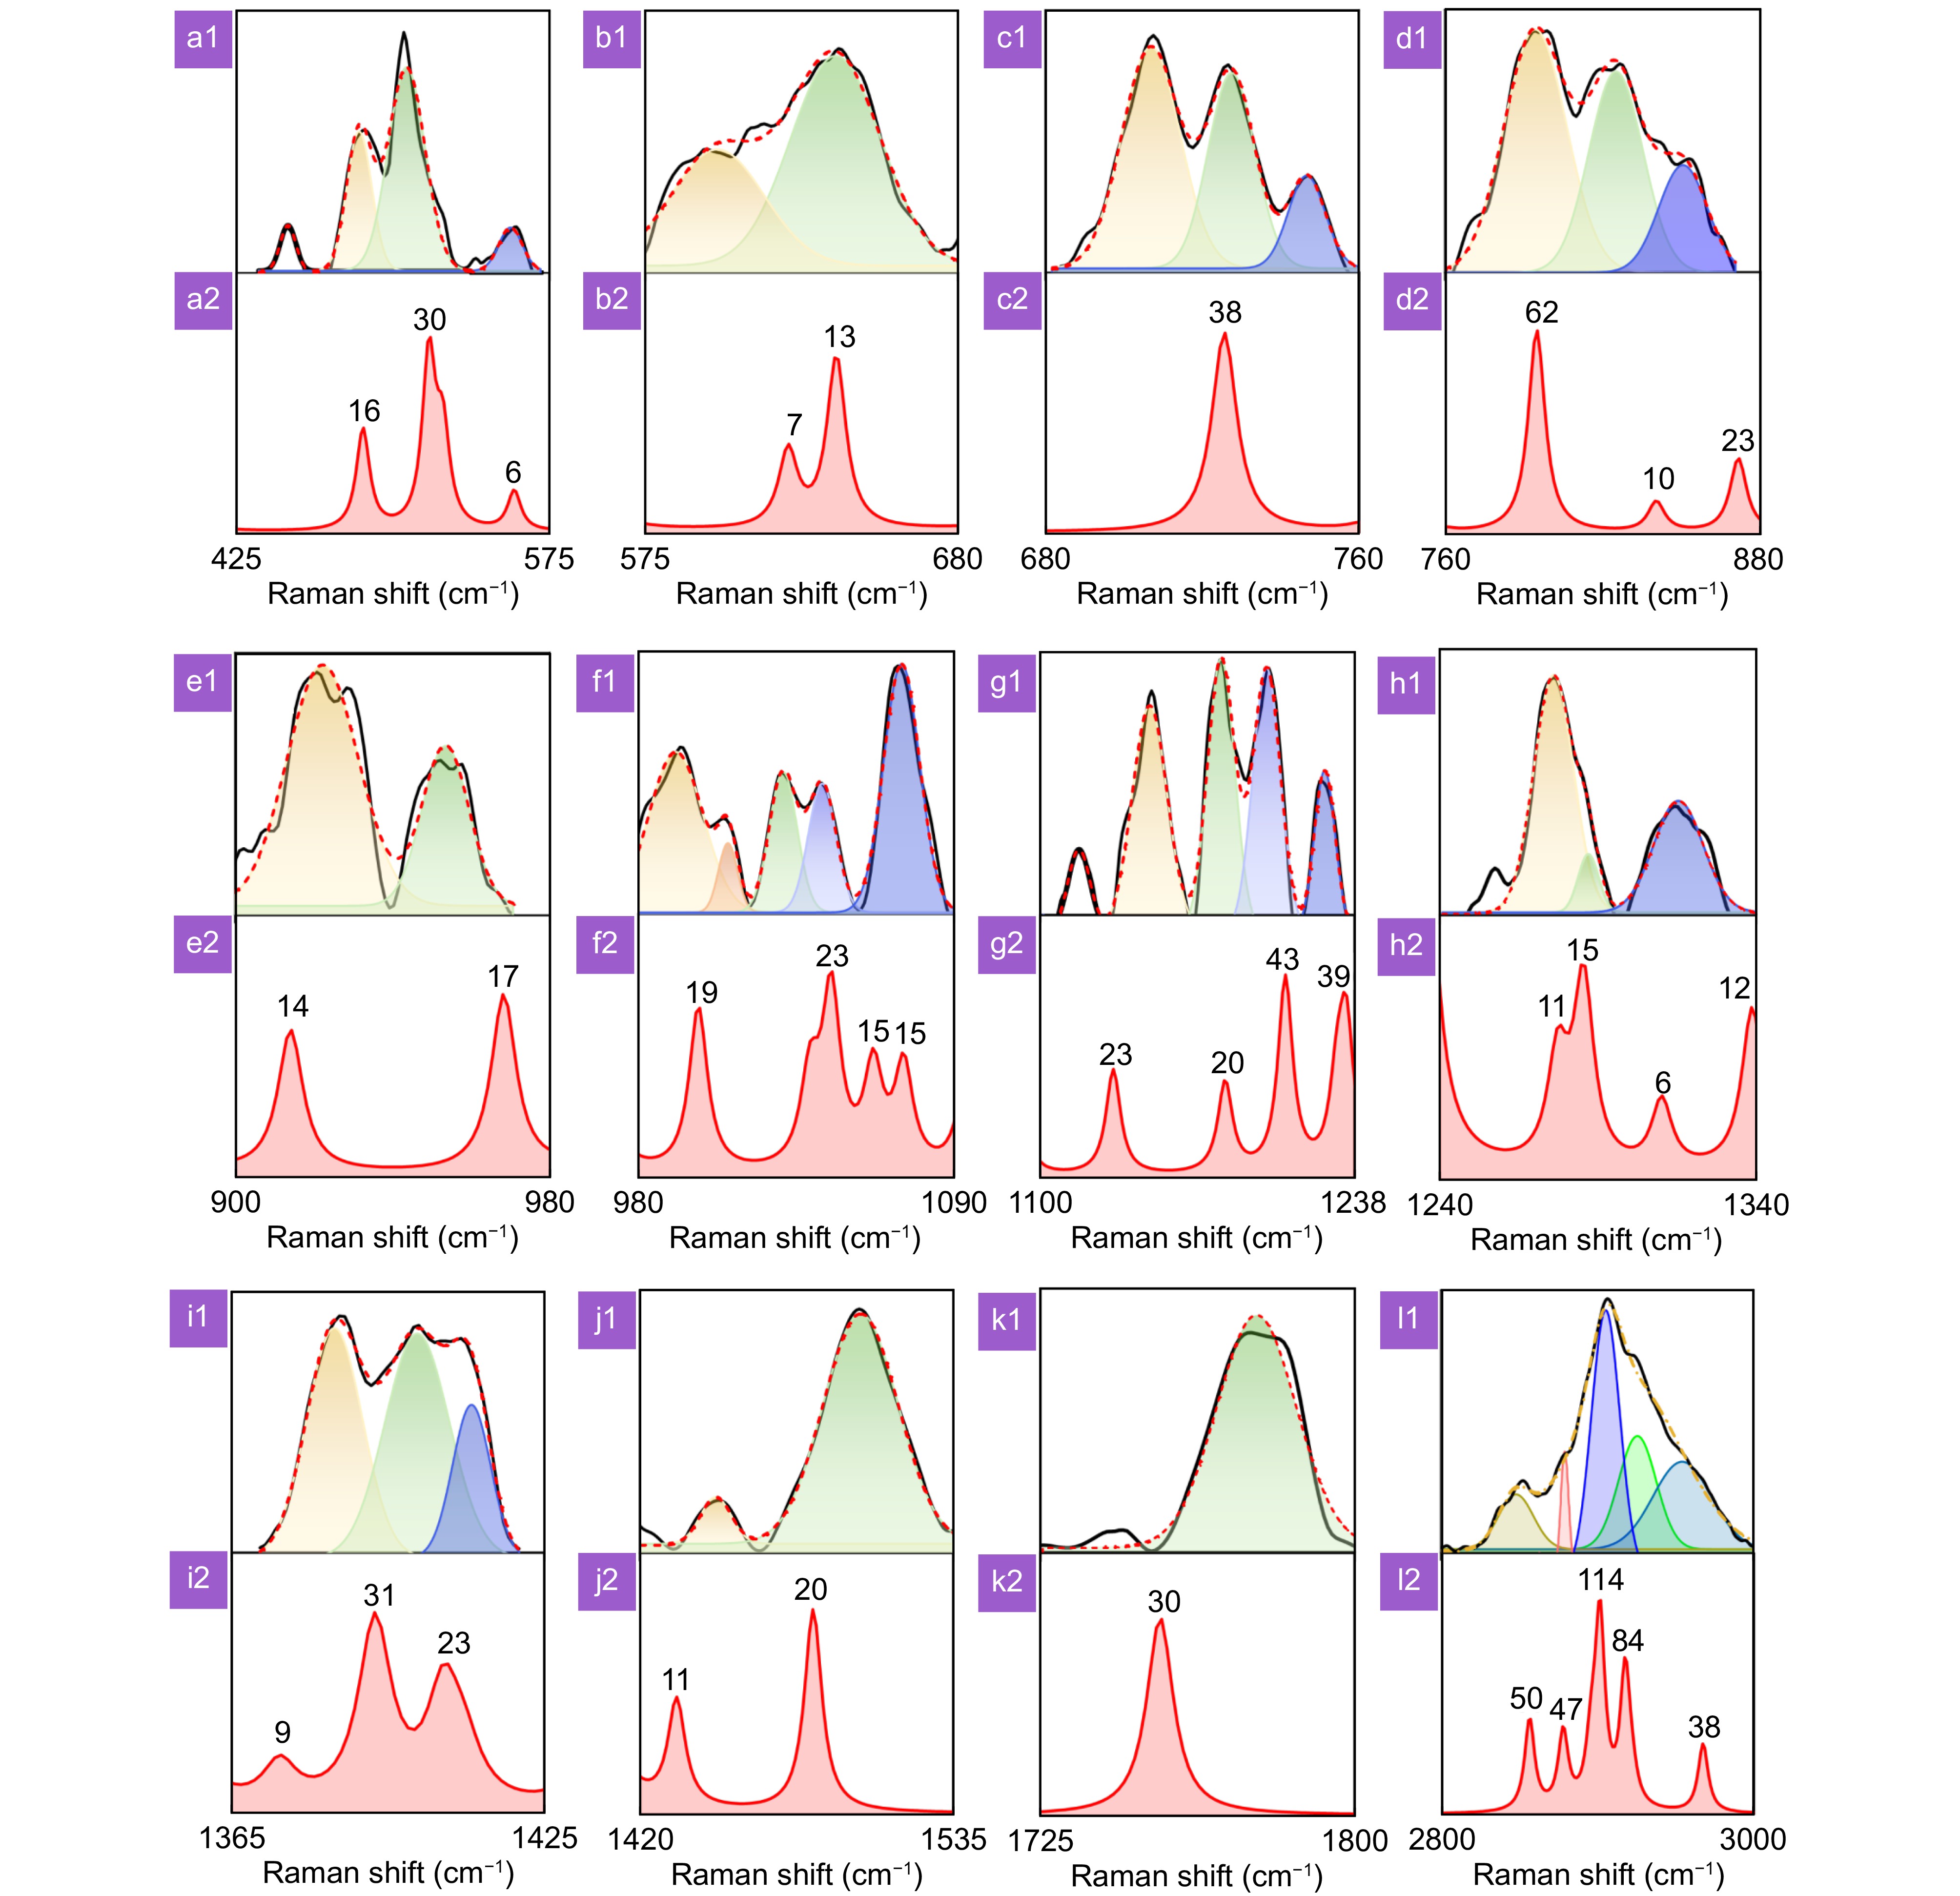
Figure 4.
Vibrational modes identification of chain glucose molecules. Multi-peak Gaussian curve-fitting analysis of SNOM-TERS spectrum of chain glucose molecules within (a1–l1) twelve spectral windows and (a2–l2) corresponding DFT calculations.


