
 E-mail Alert
 RSS
RSS
| Citation: |
Huang YR, Zhang ZM, Tao WL et al. Multiplexed stimulated emission depletion nanoscopy (mSTED) for 5-color live-cell long-term imaging of organelle interactome. Opto-Electron Adv 7, 240035 (2024). doi: 10.29026/oea.2024.240035

|
Multiplexed stimulated emission depletion nanoscopy (mSTED) for 5-color live-cell long-term imaging of organelle interactome
-
Abstract
Stimulated emission depletion microscopy (STED) holds great potential in biological science applications, especially in studying nanoscale subcellular structures. However, multi-color STED imaging in live-cell remains challenging due to the limited excitation wavelengths and large amount of laser radiation. Here, we develop a multiplexed live-cell STED method to observe more structures simultaneously with limited photo-bleaching and photo-cytotoxicity. By separating live-cell fluorescent probes with similar spectral properties using phasor analysis, our method enables five-color live-cell STED imaging and reveals long-term interactions between different subcellular structures. The results here provide an avenue for understanding the complex and delicate interactome of subcellular structures in live-cell.-
Keywords:
- optical nanoscopy /
- phasor analysis /
- multicolor live cell imaging
-

-
References
[1] Dong DS, Huang XS, Li LJ et al. Super-resolution fluorescence-assisted diffraction computational tomography reveals the three-dimensional landscape of the cellular organelle interactome. Light Sci Appl 9, 11 (2020). doi: 10.1038/s41377-020-0249-4 [2] Valm AM, Cohen S, Legant WR et al. Applying systems-level spectral imaging and analysis to reveal the organelle interactome. Nature 546, 162–167 (2017). doi: 10.1038/nature22369 [3] Abbe E. Beiträge zur Theorie des Mikroskops und der mikroskopischen Wahrnehmung. Archiv Mikrosk Anatom 9, 413–468 (1873). doi: 10.1007/BF02956173 [4] Hell SW, Wichmann J. Breaking the diffraction resolution limit by stimulated emission: stimulated-emission-depletion fluorescence microscopy. Opt Lett 19, 780–782 (1994). doi: 10.1364/OL.19.000780 [5] Gustafsson MGL. Surpassing the lateral resolution limit by a factor of two using structured illumination microscopy. J Microsc 198, 82–87 (2000). doi: 10.1046/j.1365-2818.2000.00710.x [6] Klar TA, Jakobs S, Dyba M et al. Fluorescence microscopy with diffraction resolution barrier broken by stimulated emission. Proc Natl Acad Sci USA 97, 8206–8210 (2000). doi: 10.1073/pnas.97.15.8206 [7] Betzig E, Patterson GH, Sougrat R et al. Imaging intracellular fluorescent proteins at nanometer resolution. Science 313, 1642–1645 (2006). doi: 10.1126/science.1127344 [8] Rust MJ, Bates M, Zhuang XW. Sub-diffraction-limit imaging by stochastic optical reconstruction microscopy (STORM). Nat Methods 3, 793–796 (2006). doi: 10.1038/nmeth929 [9] Huang B, Wang WQ, Bates M et al. Three-dimensional super-resolution imaging by stochastic optical reconstruction microscopy. Science 319, 810–813 (2008). doi: 10.1126/science.1153529 [10] Shroff H, Galbraith CG, Galbraith JA et al. Live-cell photoactivated localization microscopy of nanoscale adhesion dynamics. Nat Methods 5, 417–423 (2008). doi: 10.1038/nmeth.1202 [11] Müller CB, Enderlein J. Image scanning microscopy. Phys Rev Lett 104, 198101 (2010). doi: 10.1103/PhysRevLett.104.198101 [12] Li CK, Le V, Wang XN et al. Resolution enhancement and background suppression in optical super-resolution imaging for biological applications. Laser Photon Rev 15, 1900084 (2021). doi: 10.1002/lpor.201900084 [13] Gould TJ, Schroeder LK, Pellett PA et al. STED microscopy. In Kubitscheck U. Fluorescence Microscopy (Wiley-VCH Verlag GmbH & Co. KGaA, Weinheim, 2017). [14] Müller T, Schumann C, Kraegeloh A. STED microscopy and its applications: new insights into cellular processes on the nanoscale. ChemPhysChem 13, 1986–2000 (2012). doi: 10.1002/cphc.201100986 [15] Vicidomini G, Bianchini P, Diaspro A. STED super-resolved microscopy. Nat Methods 15, 173–182 (2018). doi: 10.1038/nmeth.4593 [16] Hebisch E, Wagner E, Westphal V et al. A protocol for registration and correction of multicolour STED superresolution images. J Microsc 267, 160–175 (2017). doi: 10.1111/jmi.12556 [17] Mehedi M, Smelkinson M, Kabat J et al. Multicolor stimulated emission depletion (STED) microscopy to generate high-resolution images of respiratory syncytial virus particles and infected cells. Bio-Protocol 7, e2543 (2017). doi: 10.21769/BioProtoc.2543 [18] Winter FR, Loidolt M, Westphal V et al. Multicolour nanoscopy of fixed and living cells with a single STED beam and hyperspectral detection. Sci Rep 7, 46492 (2017). doi: 10.1038/srep46492 [19] Pellett PA, Sun XL, Gould TJ et al. Two-color STED microscopy in living cells. Biomed Opt Express 2, 2364–2371 (2011). doi: 10.1364/BOE.2.002364 [20] Bottanelli F, Kromann EB, Allgeyer ES et al. Two-colour live-cell nanoscale imaging of intracellular targets. Nat Commun 7, 10778 (2016). doi: 10.1038/ncomms10778 [21] Sidenstein SC, D’Este E, Böhm MJ et al. Multicolour multilevel STED nanoscopy of actin/spectrin organization at synapses. Sci Rep 6, 26725 (2016). doi: 10.1038/srep26725 [22] Tonnesen J, Nadrigny F, Willig KI et al. Two-color STED microscopy of living synapses using a single laser-beam pair. Biophys J 101, 2545–2552 (2011). doi: 10.1016/j.bpj.2011.10.011 [23] Spahn C, Grimm JB, Lavis LD et al. Whole-cell, 3D, and multicolor STED imaging with exchangeable fluorophores. Nano Lett 19, 500–505 (2019). doi: 10.1021/acs.nanolett.8b04385 [24] Willig KI, Wegner W, Müller A et al. Multi-label in vivo STED microscopy by parallelized switching of reversibly switchable fluorescent proteins. Cell Rep 35, 109192 (2021). doi: 10.1016/j.celrep.2021.109192 [25] Chang CW, Sud D, Mycek MA. Fluorescence lifetime imaging microscopy. Methods Cell Biol 81, 495–524 (2007). [26] Liu ZY, Pouli D, Alonzo CA et al. Mapping metabolic changes by noninvasive, multiparametric, high-resolution imaging using endogenous contrast. Sci Adv 4, eaap9302 (2018). doi: 10.1126/sciadv.aap9302 [27] Datta R, Gillette A, Stefely M et al. Recent innovations in fluorescence lifetime imaging microscopy for biology and medicine. J Biomed Opt 26, 070603 (2021). doi: 10.1117/1.JBO.26.7.070603 [28] Bückers J, Wildanger D, Vicidomini G et al. Simultaneous multi-lifetime multi-color STED imaging for colocalization analyses. Opt Express 19, 3130–3143 (2011). doi: 10.1364/OE.19.003130 [29] Niehörster T, Löschberger A, Gregor I et al. Multi-target spectrally resolved fluorescence lifetime imaging microscopy. Nat Methods 13, 257–262 (2016). doi: 10.1038/nmeth.3740 [30] Ranjit S, Malacrida L, Jameson DM et al. Fit-free analysis of fluorescence lifetime imaging data using the phasor approach. Nat Protoc 13, 1979–2004 (2018). doi: 10.1038/s41596-018-0026-5 [31] Digman MA, Caiolfa VR, Zamai M et al. The phasor approach to fluorescence lifetime imaging analysis. Biophys J 94, L14–L16 (2008). doi: 10.1529/biophysj.107.120154 [32] Torrado B, Malacrida L, Ranjit S. Linear combination properties of the phasor space in fluorescence imaging. Sensors 22, 999 (2022). doi: 10.3390/s22030999 [33] Shi W, Koo DES, Kitano M et al. Pre-processing visualization of hyperspectral fluorescent data with spectrally encoded enhanced representations. Nat Commun 11, 726 (2020). doi: 10.1038/s41467-020-14486-8 [34] Scipioni L, Rossetta A, Tedeschi G et al. Phasor S-FLIM: a new paradigm for fast and robust spectral fluorescence lifetime imaging. Nat Methods 18, 542–550 (2021). doi: 10.1038/s41592-021-01108-4 [35] Frei MS, Koch B, Hiblot J et al. Live-cell fluorescence lifetime multiplexing using synthetic fluorescent probes. ACS Chem Biol 17, 1321–1327 (2022). doi: 10.1021/acschembio.2c00041 [36] Frei MS, Tarnawski M, Roberti MJ et al. Engineered HaloTag variants for fluorescence lifetime multiplexing. Nat Methods 19, 65–70 (2022). doi: 10.1038/s41592-021-01341-x [37] Gonzalez Pisfil M, Nadelson I et al. Stimulated emission depletion microscopy with a single depletion laser using five fluorochromes and fluorescence lifetime phasor separation. Sci Rep 12, 14027 (2022). doi: 10.1038/s41598-022-17825-5 [38] Battisti A, Digman MA, Gratton E et al. Intracellular pH measurements made simple by fluorescent protein probes and the phasor approach to fluorescence lifetime imaging. Chem Commun 48, 5127–5129 (2012). doi: 10.1039/c2cc30373f [39] Shim SH, Xia CL, Zhong GS et al. Super-resolution fluorescence imaging of organelles in live cells with photoswitchable membrane probes. Proc Natl Acad Sci USA 109, 13978–13983 (2012). doi: 10.1073/pnas.1201882109 [40] Vasquez RJ, Howell B, Yvon AM et al. Nanomolar concentrations of nocodazole alter microtubule dynamic instability in vivo and in vitro. Mol Biol Cell 8, 973–985 (1997). doi: 10.1091/mbc.8.6.973 [41] Zhang YD, Schroeder LK, Lessard MD et al. Nanoscale subcellular architecture revealed by multicolor three-dimensional salvaged fluorescence imaging. Nat Methods 17, 225–231 (2020). doi: 10.1038/s41592-019-0676-4 -
Supplementary Information
Supplementary information for Multiplexed stimulated emission depletion nanoscopy (mSTED) for 5-color live-cell longterm imaging of organelle interactome 
-
Access History
Figures(4)
Article Metrics

Export File
Citation
Huang YR, Zhang ZM, Tao WL et al. Multiplexed stimulated emission depletion nanoscopy (mSTED) for 5-color live-cell long-term imaging of organelle interactome. Opto-Electron Adv 7, 240035 (2024). doi: 10.29026/oea.2024.240035
Format
Content
 DownLoad:
-
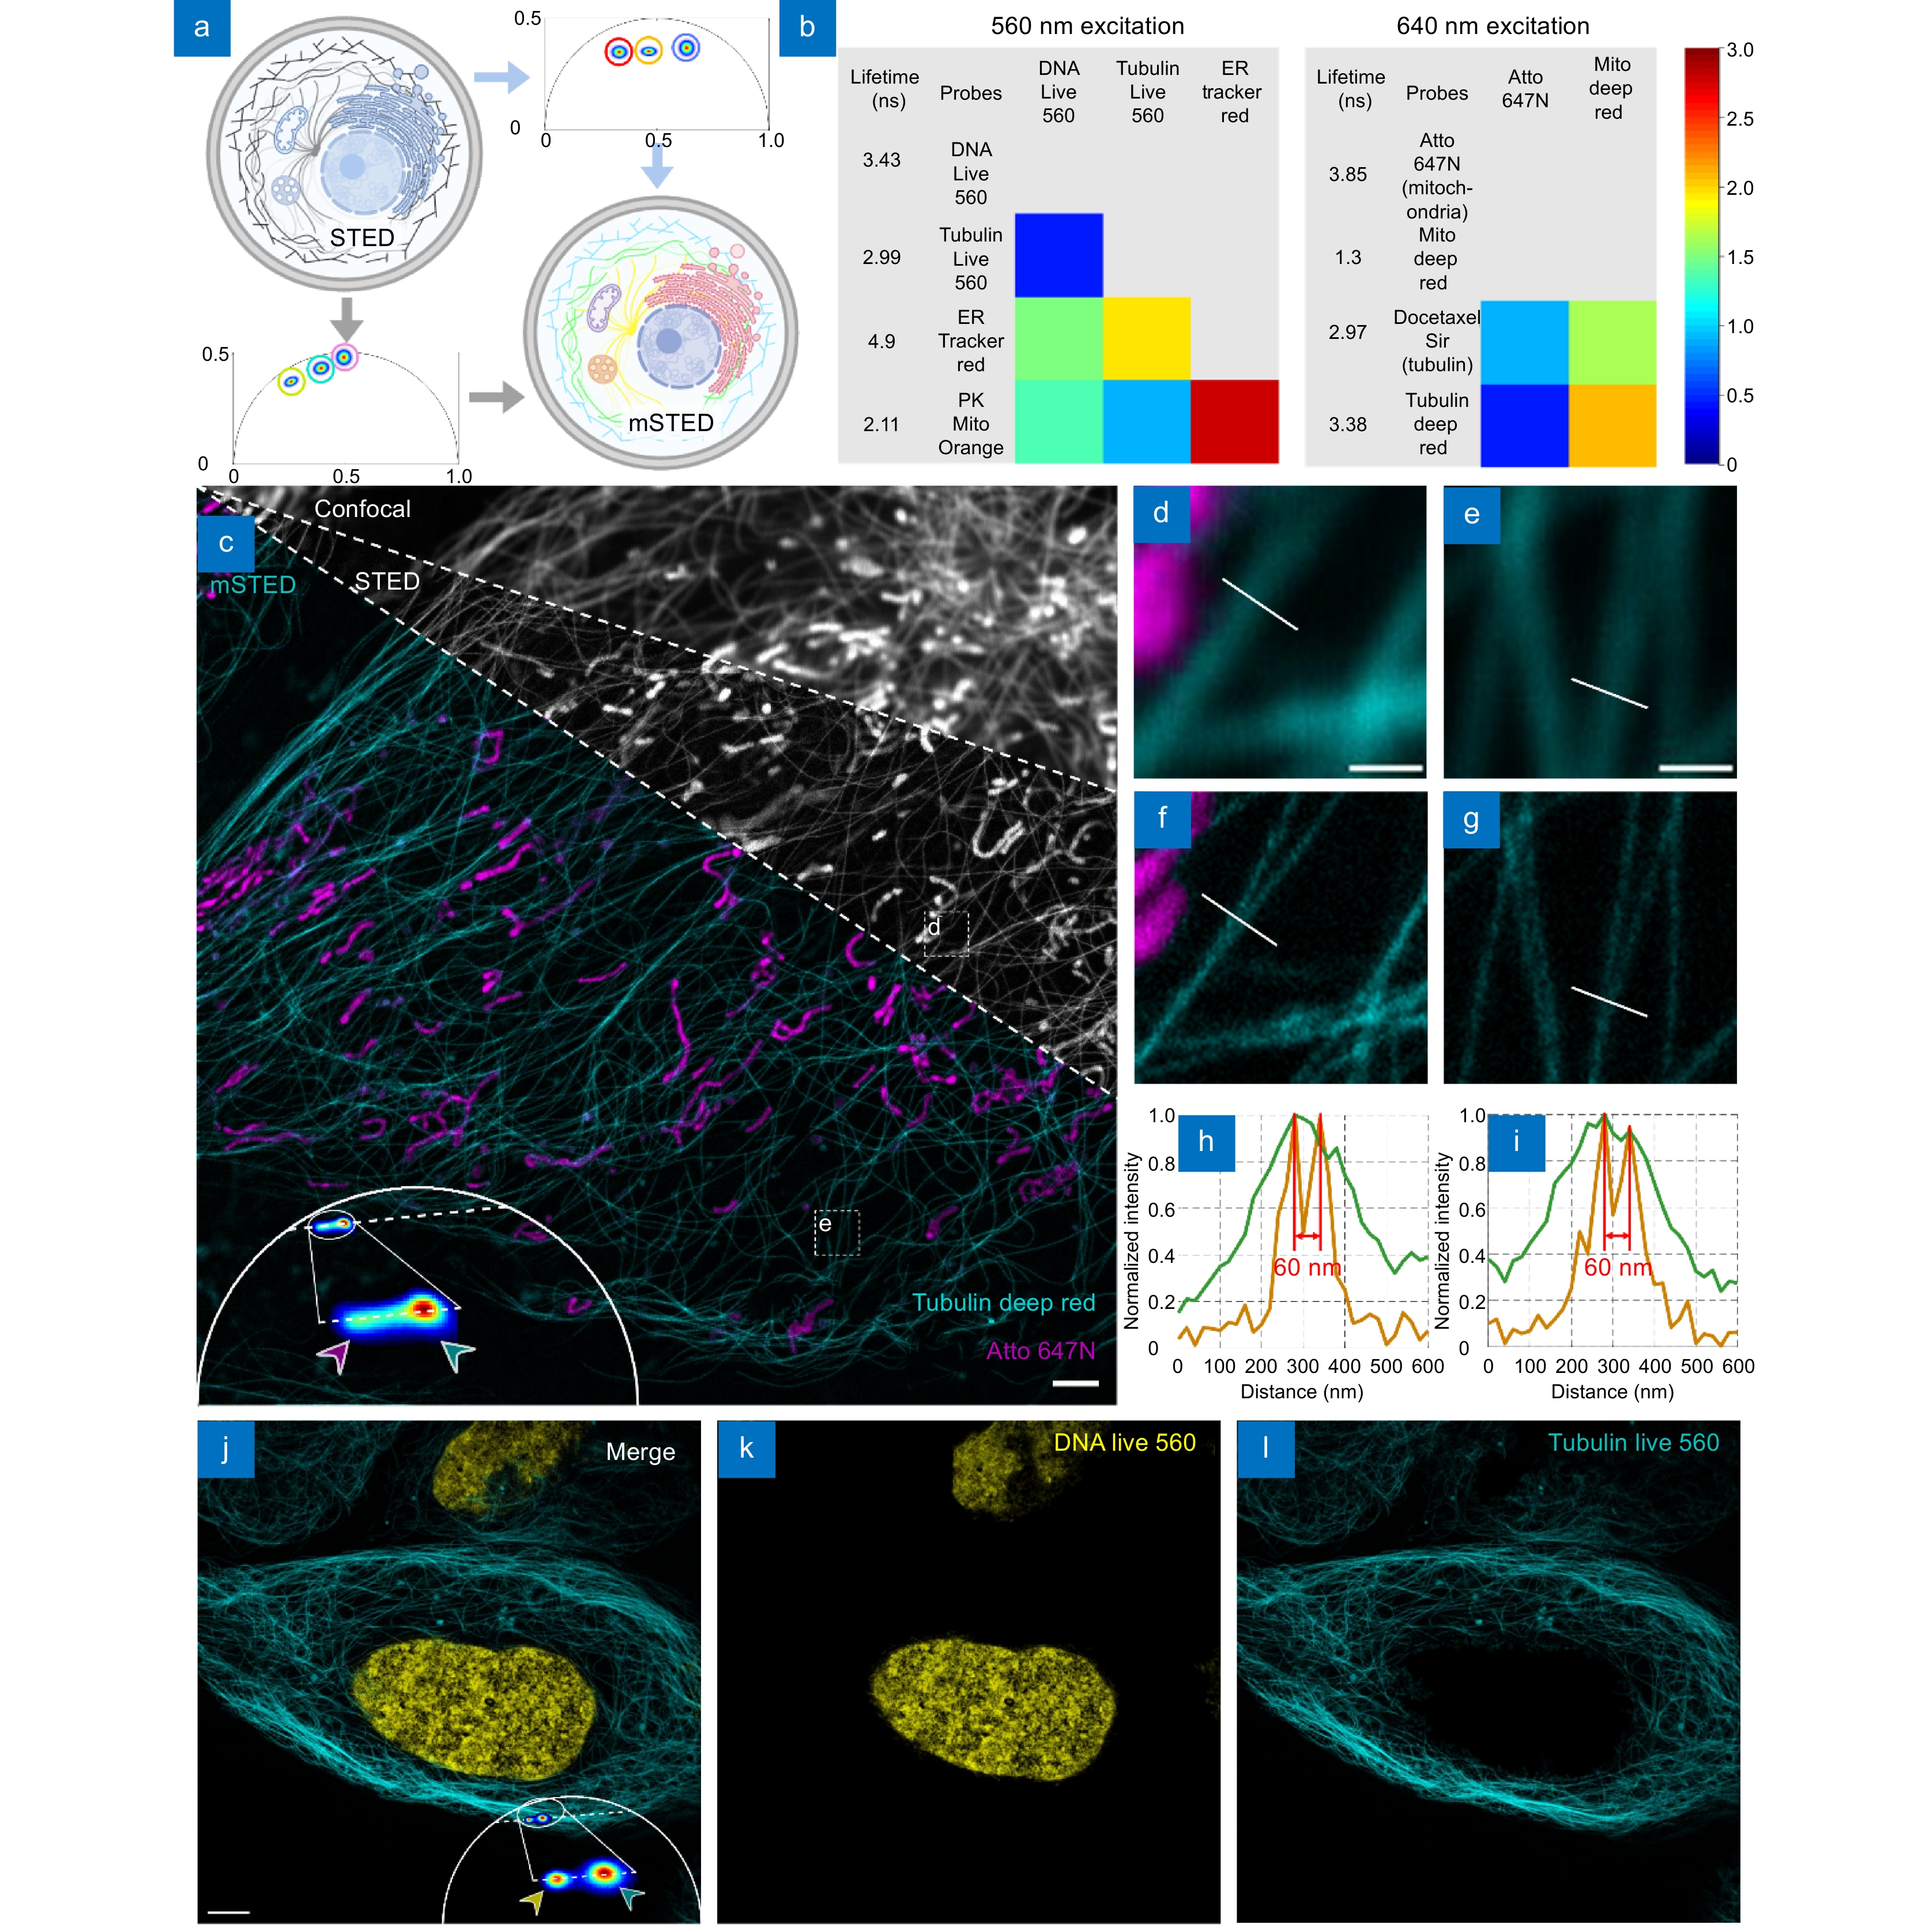
Figure 1.
mSTED structure identification. (a) Schematic diagram of fluorescence lifetime multiplexing, where spectral multiplexing contains only a limited number of spectral channels, whereas lifetime multiplexing by phasor analysis allows simultaneous observation of all the different structures. (b) Fluorescent probe selection strategy, four live-cell STED probes were selected at 560 nm and 640 nm excitation wavelength each and the difference in fluorescence lifetimes between them was measured. (c) Comparison of mSTED with confocal and STED, the greyscale image represents the intensity map obtained by Confocal and STED imaging, while the colored image demonstrates that mSTED can identify mitochondria and microtubules after phase analysis. The phasor points are projected onto the fitted line and further classified, ultimately leading to the segmentation of the intensity image. Live U2OS cells were labeled with Atto 647N (magenta; mitochondria) and Tubulin Deep Red (cyan; microtubules). The two structures were simultaneously excited by a beam at a wavelength of 640 nm. The clusters indicated by magenta and cyan arrows in the phasor plot correspond to mitochondria and microtubules, respectively. (d–g) Comparison of mSTED imaging versus confocal imaging of segmented mitochondria and microtubules, corresponding to the regions marked by the white boxes in (c). (h, i) Line profiles along the dotted lines in (f, g) which show that STED is able to separate two microtubules in close proximity, revealing details unobservable by confocal images. The presence of sharp peaks in the profile suggests that the mSTED image exhibits a resolution of 60 nm. (j–l) Identification of DNA and microtubules using mSTED in the 560-nm excitation channel. Live U2OS cells were labeled with DNA Live 560 (yellow; DNA) and Tubulin Live 560 (cyan; microtubules). Scale bars: (c) 2 μm; (d, e) 500 nm; (j) 5 μm.
-
Figure 2.
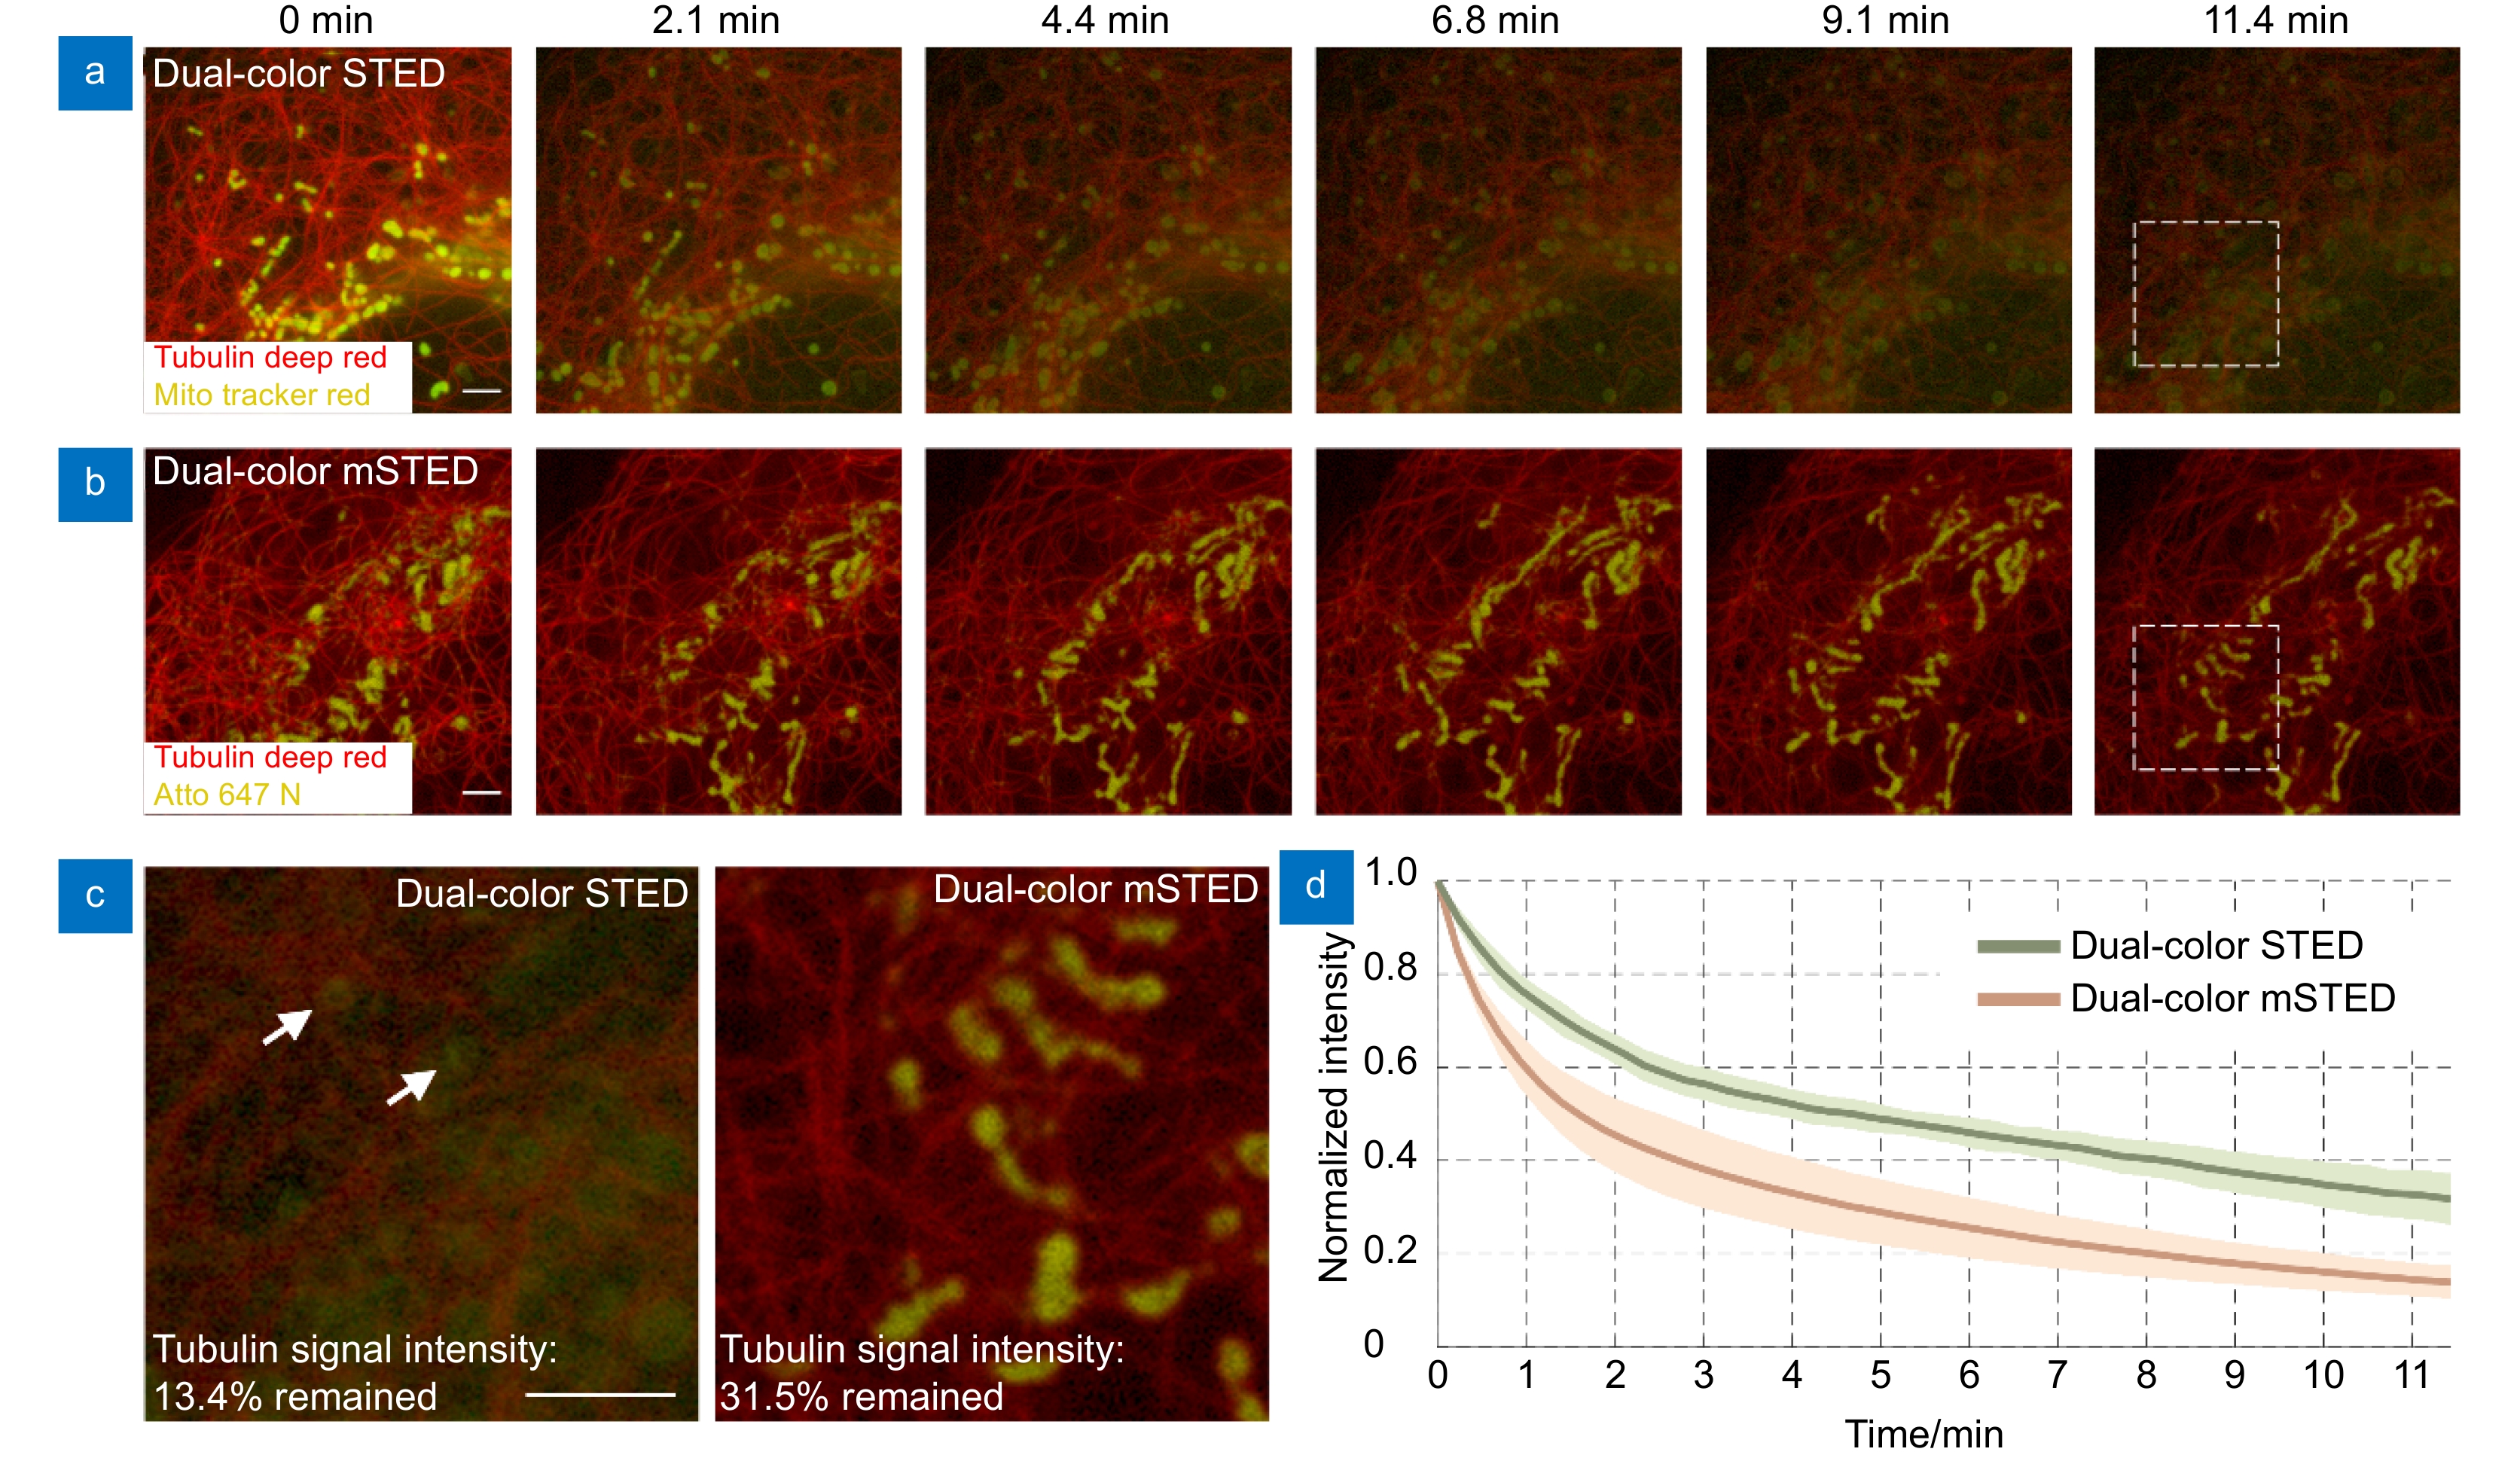
Photo-bleaching and photo-cytotoxicity of mSTED. (a) Traditional dual-color STED imaging of mitochondria and microtubules in live-cell, labeled with Tubulin Deep Red (red; microtubules) and Mito Tracker Red (yellow; mitochondria) and excited alternately with two beams at wavelengths of 640 nm and 561 nm. (b) Dual-color mSTED imaging of mitochondria and microtubules in live-cell, labeled with Tubulin Deep Red (red; microtubules) and Mito Tracker Red (yellow; mitochondria) and excited simultaneously with a beam at wavelength 640 nm. For the time-lapse imaging, the acquire time was 10 μs for each single dual-color image in traditional STED and 10 μs for dual-color mSTED, and the interval time between each image was set as 14 s. Representative frames were displayed. (c) magnified views of the white-boxed regions in (a, b). (d) Photo-bleaching curves of the same probe Tubulin Deep Red under dual-color STED and mSTED imaging (mean value ± standard deviation). Scale bars: 2 μm.
-
Figure 3.
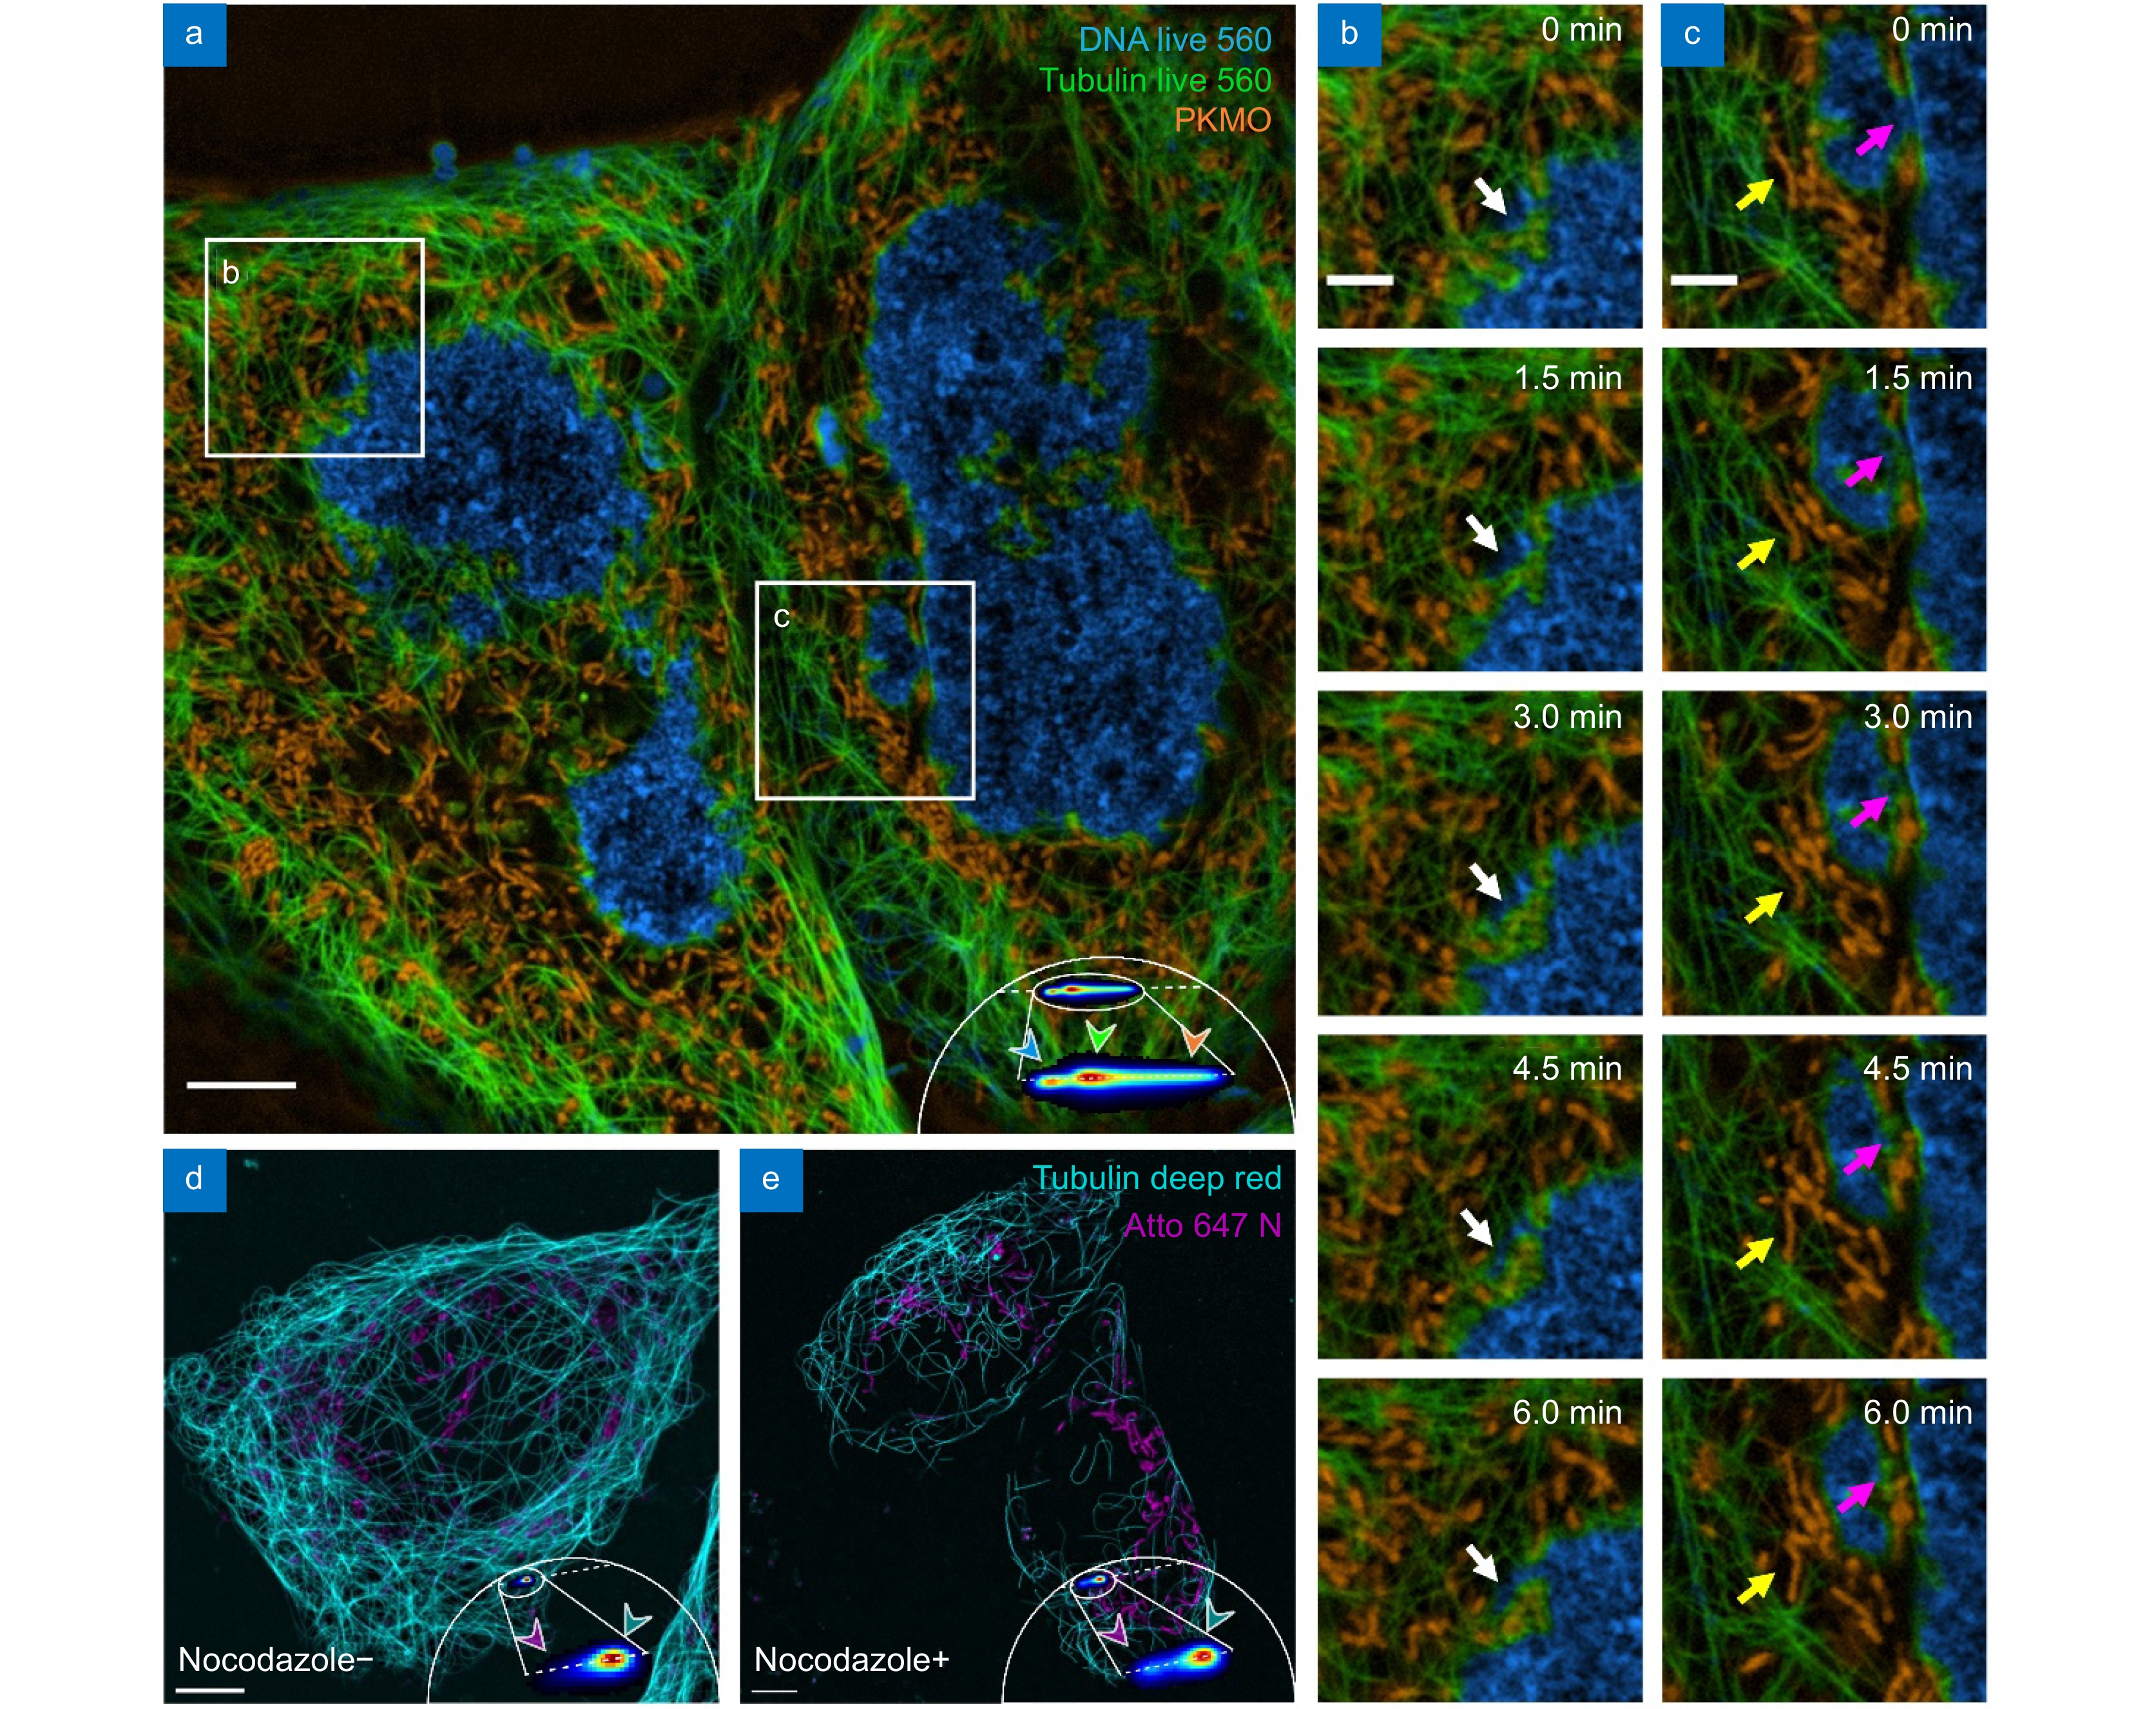
Multi-color live-cell mSTED using a single excitation beam. (a) Three-color imaging result of mSTED. Live U2OS cells were labeled with DNA Live 560 (blue; DNA), Tubulin Live 560 (green; microtubules), and PK Mito Orange (orange; mitochondria). (b, c) Cellular activity in the regions marked by the white boxes in (a). (d, e) Live U2OS cells were labeled with Tubulin Deep Red (cyan; microtubules) and Atto 647N (magenta; mitochondria) and imaged with mSTED (d) before and (e) after the addition of nocodazole. Scale bars: (a, d, e) 5 μm; (b, c) 2 μm.
-
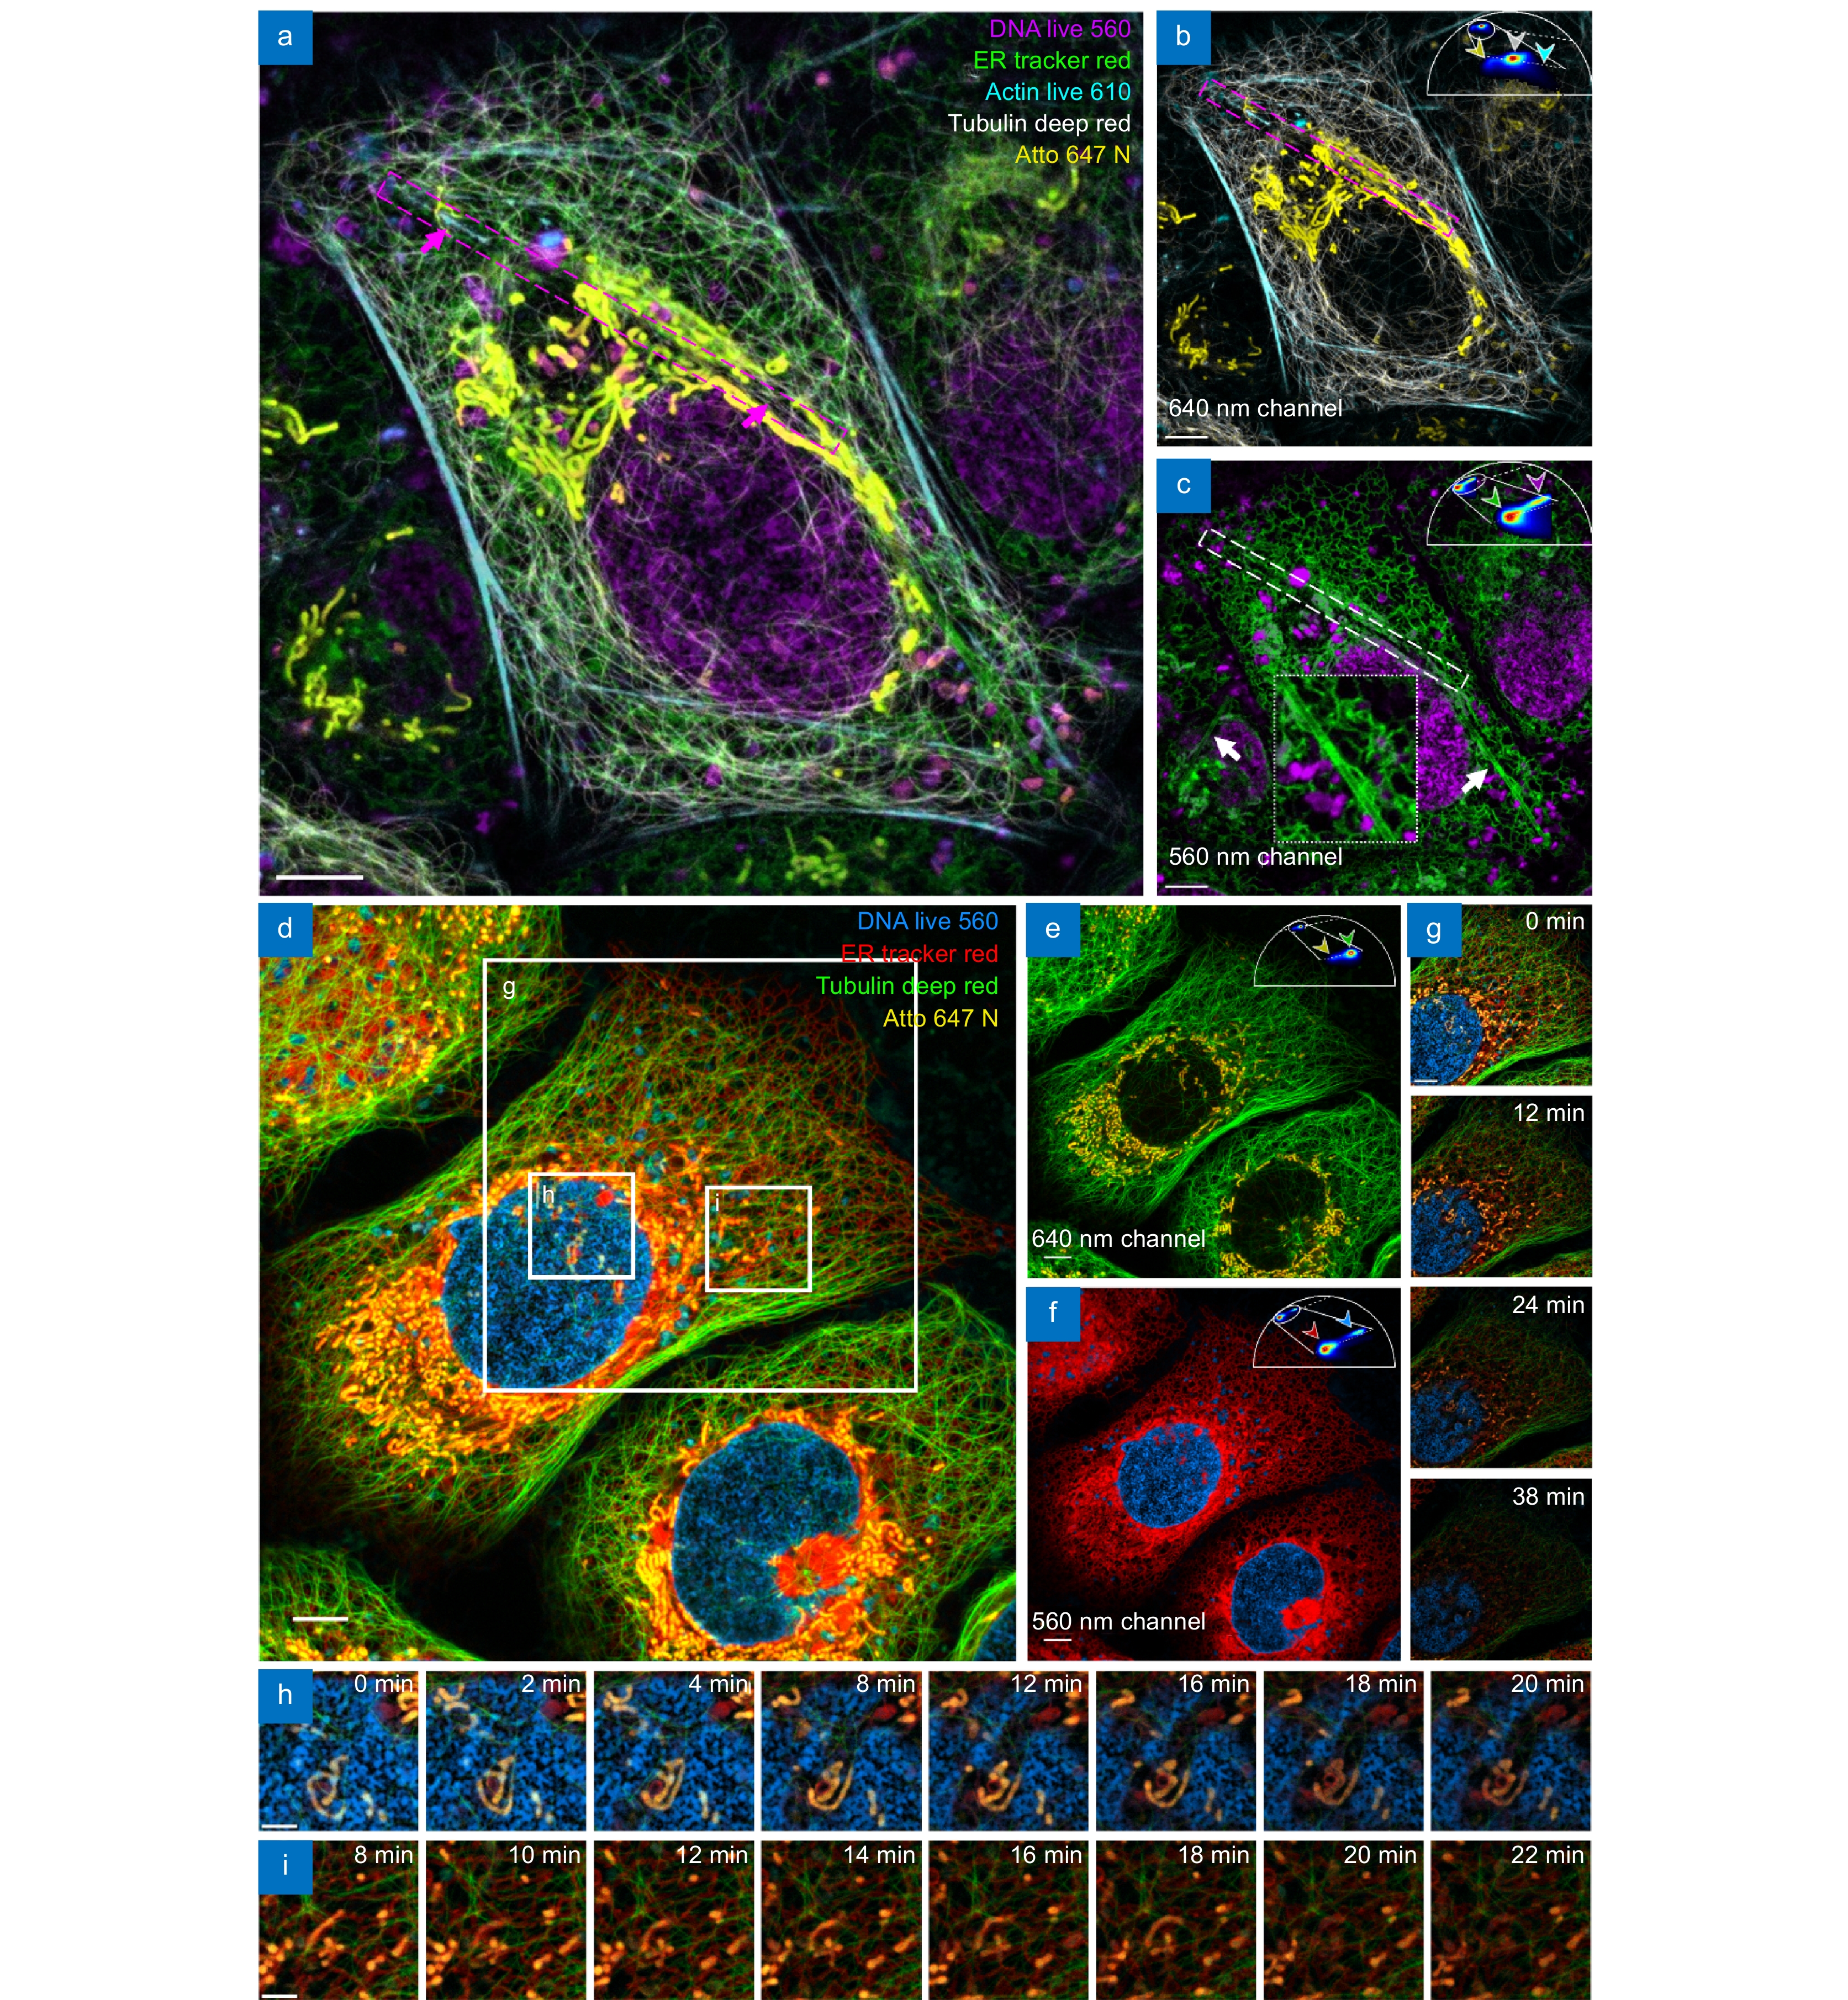
Figure 4.
Extending mSTED through both spectra and fluorescence lifetime property separation. (a–c) Five-color live-cell mSTED imaging of live U2OS cells stained with DNA Live 560 (magenta; DNA), ER Tracker Red (green; Endoplasmic reticulum), Atto 647N (yellow; mitochondria), Tubulin Deep Red (white; microtubules), and Actin Live 610 (cyan; F-actin). (d–f) Four-color live-cell imaging results, Images of fluorescent probes excited at (b, e) 640-nm and (c, f) 560-nm laser wavelength. (g–i) Cellular activity in the boxed regions in (d) over a 38-minute period, with (h) and (i) demonstrating the interaction of multiple structures at different time points. Scale bars: (a–g) 5 μm; (h, i) 2 μm.


