
 E-mail Alert
 RSS
RSS
| Citation: |
Yin Lijian, Rao Yunjiang, Dai Jianhua, et al. A feasibility study of using fiber-optic Raman spectrum system for fast diagnosis of gastric cancer[J]. Opto-Electronic Engineering, 2019, 46(4): 180645. doi: 10.12086/oee.2019.180645

|
A feasibility study of using fiber-optic Raman spectrum system for fast diagnosis of gastric cancer
-
Abstract
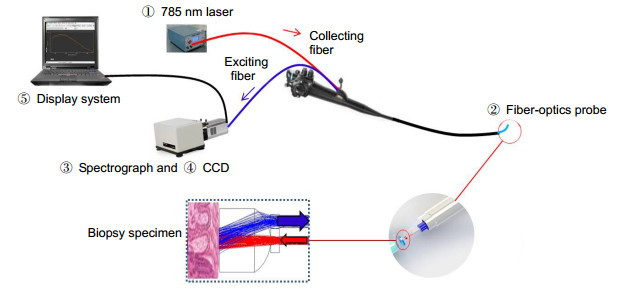
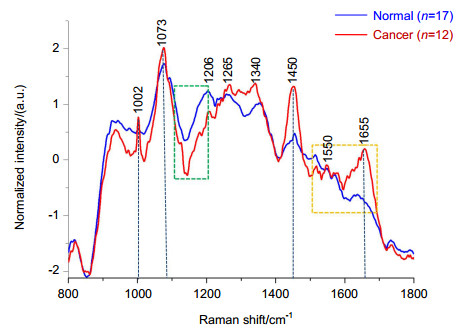
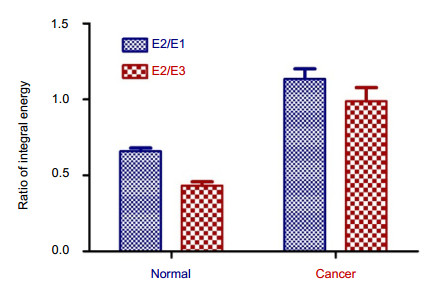
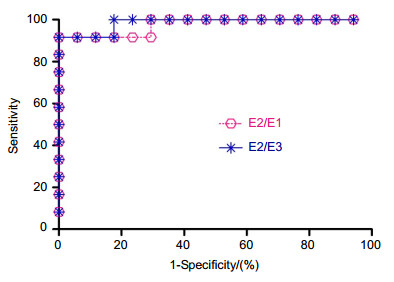
A method for fast diagnosing gastric cancer is proposed, by combining optical fiber Raman spectroscopy system matching the gastroscope with the ratios of the spectral integral energy. we complete the detecting of Raman spectra from 17 samples of normal gastric mucosa and 12 samples of gastric adenocarcinoma mucosa using the optical fiber Raman spectroscopy system (excitation wavelength of 785 nm light, power of 50 mW, the CCD temperature to 80 ℃, acquisition time 1 s). Then, the original Raman spectra were pretreated, through reducing the baseline and smoothing by fast Fourier transformation (FFT). Finally, according to the characters of Raman spectra, Raman characteristic peaks were analyzed. At the same time, we compared the ratio of integral energy of continuous band (1500 cm-1~1700 cm-1) and non-continuous band (1100 cm-1~1200 cm-1). The results show that the intensity of Raman peak of gastric adenocarcinoma at 1002 cm-1、1073 cm-1、1450 cm-1、1655 cm-1 belonging to phenylalanine and proteins are higher than that of normal mucosal relatively. From continuous band (1500 cm-1~ 1700 cm-1) and non-continuous band (1100 cm-1~1200 cm-1), the ratios of the spectral integral energy of gastric adenocarcinoma were different with normal mucosa markedly(independent samples t test, P < 0.05), and with the ratio of the integral energy for use as a diagnostic index, obtained the higher accuracy (97.5%~98.5%), sensitivity (91.7%) and specific degrees (100.0%).-
Keywords:
- optical fiber /
- Raman spectrum /
- gastric cancer /
- diagnosis
-

-
References
[1] Chen W Q, Zheng R S, Baade P D, et al. Cancer statistics in China, 2015[J]. CA:A Cancer Journal for Clinicians, 2016, 66(2):115-132. doi: 10.3322/caac.21338 [2] Venerito M, Vasapolli R, Rokkas T, et al. Gastric cancer:epidemiology, prevention, and therapy[J]. Helicobacter, 2018, 23(S1):e12518. [3] Strong V E, Wu A, Selby L V, et al. Differences in gastric cancer survival between the U.S. and China[J]. Journal of Surgical Oncology, 2015, 112(1):31-37. doi: 10.1002/jso.23940 [4] Menon S, Trudgill N. How commonly is upper gastrointestinal cancer missed at endoscopy? A meta-analysis[J]. Endoscopy International Open, 2014, 2(2):E46-E50. doi: 10.1055/s-00025476 [5] Song Z Y, Wu Y Y, Yang J B, et al. Progress in the treatment of advanced gastric cancer[J]. Tumor Biology, 2017, 39(7):1-7. doi: 10.1177/1010428317714626 [6] Kato M, Nishida T, Yamamoto K, et al. Scheduled endoscopic surveillance controls secondary cancer after curative endoscopic resection for early gastric cancer:a multicentre retrospective cohort study by Osaka University ESD study group[J]. Gut, 2013, 62(10):1425-1432. doi: 10.1136/gutjnl-2011-301647 [7] Tsurudome I, Miyahara R, Funasaka K, et al. In vivo histological diagnosis for gastric cancer using endocytoscopy[J]. World Journal of Gastroenterology, 2017, 23(37):6894-6901. doi: 10.3748/wjg.v23.i37.6894 [8] 杨序纲吴琪琳.拉曼光谱的分析与应用[M].北京:国防工业出版社, 2008:267-273. Yang X G, Wu Q L. Raman Spectroscopy Analysis and Application[M]. Beijing:National Defense Industry Press, 2008:267-273. [9] Almond L M, Hutchings J C, Kendall C A, et al. Assessment of a custom-built Raman spectroscopic probe for diagnosis of early oesophageal neoplasia[J]. Journal of Biomedical Optics, 2012, 17(8):081421. doi: 10.1117/1.JBO.17.8.081421 [10] Jermyn M, Mok K, Mercier J, et al. Intraoperative brain cancer detection with Raman spectroscopy in humans[J]. Science Translational Medicine, 2015, 7(274):274ra19. doi: 10.1126/scitranslmed.aaa2384 [11] Teh S K, Zheng W, Ho K Y, et al. Diagnostic potential of near-infrared Raman spectroscopy in the stomach:differentiating dysplasia from normal tissue[J]. British Journal of Cancer, 2008, 98(2):457-465. doi: 10.1038/sj.bjc.6604176 [12] Huang Z, McWilliams A, Lui H, et al. Near-infrared Raman spectroscopy for optical diagnosis of lung cancer[J]. International Journal of Cancer, 2003, 107(6):1047-1052. doi: 10.1002/(ISSN)1097-0215 [13] Petersen D, Naveed P, Ragheb A, et al. Raman fiber-optical method for colon cancer detection:cross-validation and outlier identification approach[J]. Spectrochimica Acta Part A:Molecular and Biomolecular Spectroscopy, 2017, 181:270-275. doi: 10.1016/j.saa.2017.03.054 [14] Zhao J H, Zeng H S, Kalia S, et al. Using Raman spectroscopy to detect and diagnose skin cancer in vivo[J]. Dermatologic Clinics, 2017, 35(4):495-504. doi: 10.1016/j.det.2017.06.010 [15] 褚小立.化学计量学方法与分子光谱分析技术[M].北京:化学工业出版社, 2011:41-48. Chu X L. Molecular Spectroscopy Analytical Technology Combined with Chemometrics and its Applications[M]. Beijing:Chemical Industry Press, 2011:41-48. [16] Naumann D. Ft-infrared and Ft-Raman spectroscopy in biomedical research[J]. Applied Spectroscopy Reviews, 2001, 36(2-3):239-298. doi: 10.1081/ASR-100106157 [17] Omberg K M, Osborn J C, Zhang S L, et al. Raman spectroscopy and factor analysis of tumorigenic and non-tumorigenic cells[J]. Applied Spectroscopy, 2002, 56(7):813-819. doi: 10.1366/000370202760171464 [18] Boyd A R, McManus L L, Burke G A, et al. Raman spectroscopy of primary bovine aortic endothelial cells:a comparison of single cell and cell cluster analysis[J]. Journal of Materials Science:Materials in Medicine, 2011, 22(8):1923-1930. doi: 10.1007/s10856-011-4371-y [19] Zhou X Q, Dai J H, Chen Y, et al. Evaluation of the diagnostic potential of ex vivo Raman spectroscopy in gastric cancers:fingerprint versus high wavenumber[J]. Journal of Biomedical Optics, 2016, 21(10):105002. doi: 10.1117/1.JBO.21.10.105002 [20] Chen Y, Dai J H, Zhou X Q, et al. Raman spectroscopy analysis of the biochemical characteristics of molecules associated with the malignant transformation of gastric mucosa[J]. PLoS One, 2014, 9(4):e93906. doi: 10.1371/journal.pone.0093906 [21] 金少琴, 毛华.近红外线激光拉曼光谱具有在分子水平诊断胃癌的价值[J].南方医科大学学报, 2014, 34(3):391-395. doi: 10.3969/j.issn.1673-4254.2014.03.21 Jin S Q, Mao H. Near-infrared Raman spectroscopy for diagnosis of gastric cancer[J]. Journal of Southern Medical University, 2014, 34(3):391-395. doi: 10.3969/j.issn.1673-4254.2014.03.21 [22] Lario S, Ramírez-Lázaro M J, Sanjuan-Herráez D, et al. Plasma sample based analysis of gastric cancer progression using targeted metabolomics[J]. Scientific Reports, 2017, 7:17774. doi: 10.1038/s41598-017-17921-x [23] 黄学梅, 吴立翔, 吕自兰, 等.尿液对羟基苯丙氨酸检测在恶性肿瘤早期预测中的应用价值[J].检验医学与临床, 2015, 12(16):2333-2335. doi: 10.3969/j.issn.1672-9455.2015.16.014 Huang X M, Wu L X, Lv Z L, et al. Application value of urine hydroxyl phenylalanine in early predicting malignant tumor[J]. Laboratory Medicine and Clinic, 2015, 12(16):2333-2335. doi: 10.3969/j.issn.1672-9455.2015.16.014 [24] Bergholt M S, Zheng Q, Ho K Y, et al. Fiberoptic confocal Raman spectroscopy for real-time in vivo diagnosis of dysplasia in Barrett's esophagus[J]. Gastroenterology, 2014, 146(1):27-32. doi: 10.1053/j.gastro.2013.11.002 [25] Teh S K, Zheng W, Ho K Y, et al. Near-infrared Raman spectroscopy for gastric precancer diagnosis[J]. Journal of Raman Spectroscopy, 2009, 40(8):908-914. doi: 10.1002/jrs.v40:8 [26] Widjaja E, Zheng W, Huang Z W. Classification of colonic tissues using near-infrared Raman spectroscopy and support vector machines[J]. International Journal of Oncology, 2008, 32(3):653-662. doi: 10.3892/ijo.32.3.653 [27] Jermyn M, Desroches J, Mercier J, et al. Neural networks improve brain cancer detection with Raman spectroscopy in the presence of operating room light artifacts[J]. Journal of Biomedical Optics, 2016, 21(9):094002. doi: 10.1117/1.JBO.21.9.094002 -
Overview

Overview: Gastric cancer incidence and mortality is high in China. Because of the lack of specificity, the diagnosis accuracy of gastric cancer is not high. Raman spectroscopy is a kind of inelastic scattering spectroscopy based on molecular vibrations, which can provide specific information of structure and composition of tissue. Cancerous tissue can provide characteristic Raman spectra due to its composition content, structural changes. Raman spectroscopy is very suitable for the diagnosis of gastric cancer. Optical fiber Raman spectroscopy system can be used for real-time diagnosis of gastric cancer. The aim of this study was to structure a fiber Raman spectroscopy system matching the gastroscope and combining with the ratios of the spectral integral energy to diagnosis of gastric cancer fast. We used this system to collected 83 spectrum from 29 patients with biopsy examination, including 17 patients with gastric carcinoma and 12 patients with normal gastric mucosa (excitation wavelength of 785 nm light, power of 50 mW, the CCD temperature to 80 ℃, acquisition time 1 s). Original Raman spectrum contained the weak Raman spectrum of tissue itself we needed, the strong autofluorescence background and noise. By reducing the baseline to remove tissue autofluorescence background and using fast Fourier transform (FFT) to increase signal-to-noise ratio, the original Raman spectrum was preprocessed. And then we got the average spectrum of gastric cancer and normal stomach mucosa tissue respectively and analyzed the ownership of the typical Raman spectrum peak. After standardizing the average spectrum, we calculated the integral energy of Raman spectra. Raman spectrum and the ratio of integral energy from continuous band (1500 cm-1~1700 cm-1) and non-continuous band (1100 cm-1~1200 cm-1) were compared. The intensity of Raman peak of gastric adenocarcinoma at 1002 cm-1、1073 cm-1、1450 cm-1、1655 cm-1. Belonging to phenylalanine and proteins are higher than that of normal mucosal relatively. From continuous band (1500 cm-1~1700 cm-1) and non- continuous band (1100 cm-1~1200 cm-1), the ratios of the spectral integral energy of gastric adenocarcinoma were different with normal mucosa markedly (independent samples t test, P < 0.05), and with the ratio of the integral energy for use as a diagnostic index, obtained the higher accuracy (97.5%~ 98.5%), sensitivity (91.7%) and specific degrees (100.0%). Fiber Raman spectroscopy system applied in the clinical diagnosis of gastric cancer had a high value.
-
Access History
Figures(5)
Tables(2)
Article Metrics

Export File
Citation
Yin Lijian, Rao Yunjiang, Dai Jianhua, et al. A feasibility study of using fiber-optic Raman spectrum system for fast diagnosis of gastric cancer[J]. Opto-Electronic Engineering, 2019, 46(4): 180645. doi: 10.12086/oee.2019.180645
Format
Content
 DownLoad:
-
Figure 1.
Optical fiber Raman endoscopy system
-
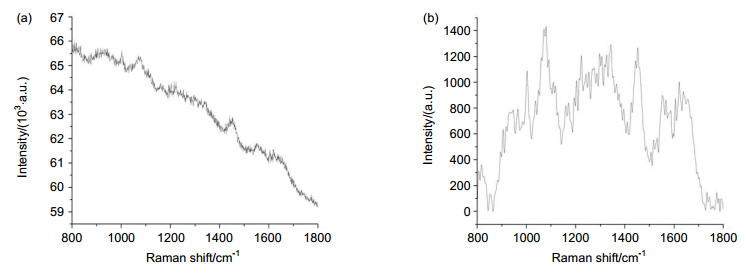
Figure 2.
(a) Original Raman spectrum; (b) Raman spectra after reduced the baseline and smoothed
-
Figure 3.
The mean normalized Raman spectra from normal(n=17, blue line) and dysplasia (n=12, red line) gastric mucosa tissue samples
-
Figure 4.
The ratio of integral energy of continuous and discontinuous frequency band of the Raman spectra
-
Figure 5.
ROC curve of continuous and discontinuous frequency band of the Raman spectra


