
 E-mail Alert
 RSS
RSS
Measurement of Si—OH content in fused silica with extended dynamic range by Fourier transform infrared spectroscopy
-
摘要:
傅里叶变换红外光谱法被广泛应用于融石英Si-OH含量测量中。然而,低Si-OH含量下水吸收峰的干扰和高Si-OH含量下吸收峰饱和限制了测量范围。使用傅里叶变换红外光谱法测量不同Si-OH含量和厚度的熔石英样品在2500 cm-1~5000 cm-1波段的透过率,消除水分子吸收带对3673 cm-1波数Si-OH吸收峰的干扰;分别使用3673 cm-1和4522 cm-1峰对不同样品的Si-OH含量、均方根误差,以及3673 cm-1和4522 cm-1峰的检测限进行计算。结合实验结果和比尔定律,建立Si-OH浓度、样品厚度、测量透过率误差与测量浓度误差之间的关联模型。根据模型,在2 mm厚度时使用3673 cm-1吸收峰测量Si-OH含量小于8.17×10⁻⁴的样品,使用4522 cm-1弱吸收峰测量Si-OH含量大于8.17×10⁻⁴的样品,可优化测量精度和扩大测量动态范围,实现2 mm厚度时熔石英(0.4~10000)×10-6大范围Si-OH含量测量。
 Abstract:
Fourier transform infrared (FTIR) spectroscopy Si—OH group is widely used in Si—OH content measurement of fused silica optics. However, the measurement accuracy is influenced by water molecular absorption bands in low Si—OH content samples and absorption saturation in high Si—OH content samples, leading to limited measurement range. FTIR spectroscopy is employed to measure 2500~5000 cm-1 transmittance spectra of fused silica samples with different OH contents and thicknesses. The interference of water molecular absorption band to 3673 cm-1 is eliminated. Then Si—OH contents, corresponding measurement errors and limits of detection at 3673 cm-1 and 4522 cm-1 bands are calculated. Based on the experimental results and Beer's law, a model to correlate Si—OH content, sample thickness, measurement error of transmittance, and measurement error of Si—OH content is established. From this model, by using 3673 cm-1 band for fused silica samples with Si-OH content less than 8.17×10⁻⁴ and 4522 cm-1 band for samples with Si—OH content more than 8.17×10⁻⁴ to measure the Si—OH content, a dynamic range from 0.4×10⁻⁶ to10-2 Si—OH can be achieved with optimized accuracy for fused silica samples with 2 mm thickness.
-

Si-OH group is the most common impurity in fused silica, which has a significant impact on the optical performance of fused silica optics from infrared to ultraviolet spectral regions. The Si-OH content can be directly measured from Si-OH stretching band at 3673 cm-1 with molar absorptivity of (77.5±1.5) L/(mol·cm). However, measurement range is limited by interference of absorption bands from water molecule in low Si-OH content samples and absorption saturation in high Si-OH content samples. Fourier transform infrared (FTIR) spectroscopy is employed to measure 2500 cm-1~5000 cm-1 transmittance spectra of fused silica samples with different Si-OH contents ranging from 0.0 to 10-3 and thicknesses ranging from 2.0 mm to 8.0 mm. Since 3000 cm-1~3100 cm-1 absorption bands from H2O molecule is not covered by other infrared (IR) absorption bands, absorption at 3673 cm-1 from H2O molecule can be eliminated using transmittance from 3000 cm-1~3100 cm-1 region and line shape of H2O band obtained by Gaussian fit from low Si-OH content samples. Compared with 4522 cm-1 absorption peak which is not interfered by any absorption bands, the Si-OH content calculated from 3673 cm-1 band without influence of water absorption band has a relative error about 2.5% lower than that directly calculated by 3673 cm-1 band in Suprasil 501 sample with about 5.0×10⁻⁵ Si-OH content and 2.0 mm thickness. After eliminating the influence of water absorption band, corresponding measurement errors and limit of detection for Si-OH content at 3673 cm-1 and 4522 cm-1 bands are calculated. Based on experimental data and Beer’s law, a model to correlate Si-OH content, sample thickness, measurement error of transmittance, and measurement error of Si-OH content is established. From this model, Si-OH content measurement error is mainly influenced by logarithm of transmittance and influence of water absorption band in low Si-OH content samples, and absorption saturation in high Si-OH content samples. Since the molar absorptivity at 4522 cm-1 is nearly 50 times weaker than that at 3673 cm-1, the corresponding transmittance at 4522 cm-1 is much lower than that at 3673 cm-1, leading to a lower relative root mean square error for Si-OH content measurement at 4522 cm-1 than that at 3673 cm-1 in high OH content samples. With 2.0 mm thickness, a relative error less than 0.13% can be achieved in sample with 10-2 Si-OH content at 4522 cm-1 absorption band. As a result, by eliminating water absorption band at 3673 cm-1 for low Si-OH content samples and employing 4522 cm-1 band for high Si-OH content samples to measure the Si-OH content, the measurement range is increased from (6.0~1810.0)×10-6 to (0.4~10000.0)×10-6 at 2.0 mm thickness with improved measurement accuracy.
-

-
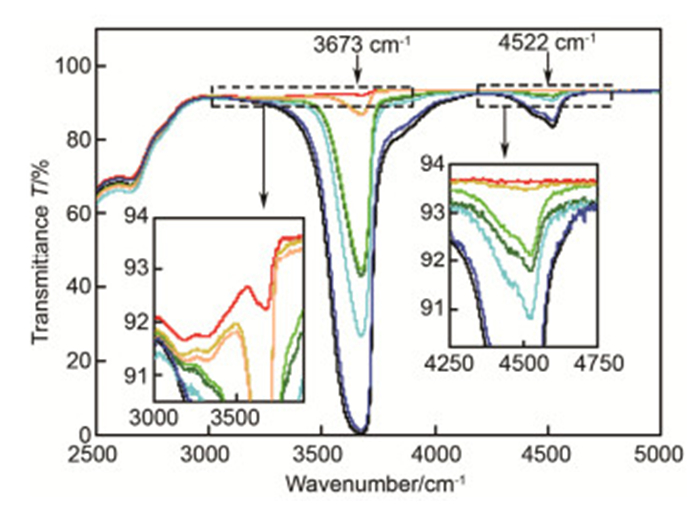
图 1 9种2.0 mm厚熔石英样品在2500 cm-1~5000 cm-1波数30次测量平均后的透过光谱。样品按Si—OH吸收峰强度由高到低分别为:Infrasil 302、HOQ 310、Suprasil 711、Suprasil 501、Herasil 3、Suprasil 401、Herasil 102、Corning 7980和Spectrosil 2000.
Figure 1. Transmittance spectra of 9 fused silica samples with 2.0 mm thickness at 2500 cm-1~5000 cm-1 wavenumber measured 30 times. The results show Si—OH absorption bands with the absorption intensity becoming smaller: Infrasil 302, HOQ 310, Suprasil 711, Suprasil 501, Herasil 3, Suprasil 401, Herasil 102, Corning 7980, Spectrosil 2000.
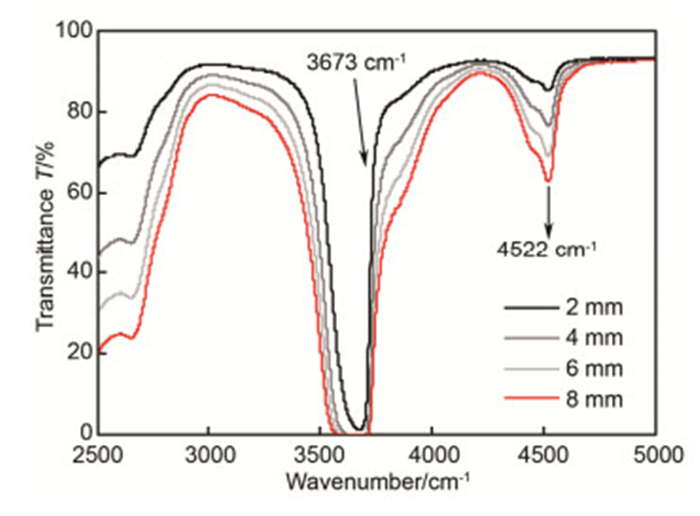
图 2 不同厚度Corning7980熔石英样品在2500 cm-1~5000 cm-1波数30次测量平均后的透射谱.
Figure 2. Transmittance spectra of Corning7980 samples with different thicknesses at 2500 cm-1~5000 cm-1 wavenumber measured 30 times.
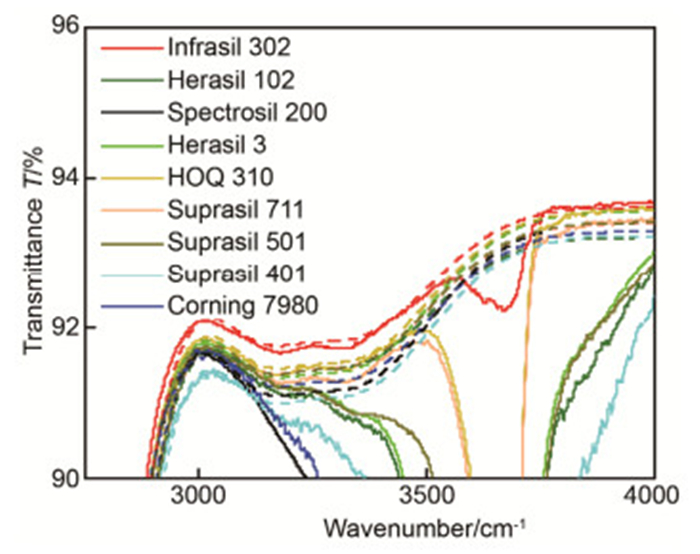
图 3 9种2.0 mm厚熔石英样品在2750 cm-1~4000 cm-1波数的实测透射谱(实线)和水分子透射谱(虚线).
Figure 3. Transmittance spectra (full line) and resolved water molecule band (dotted line) of 9 fused silica samples with 2.0 mm thickness at 2750 cm-1~4000 cm-1 wavenumber.
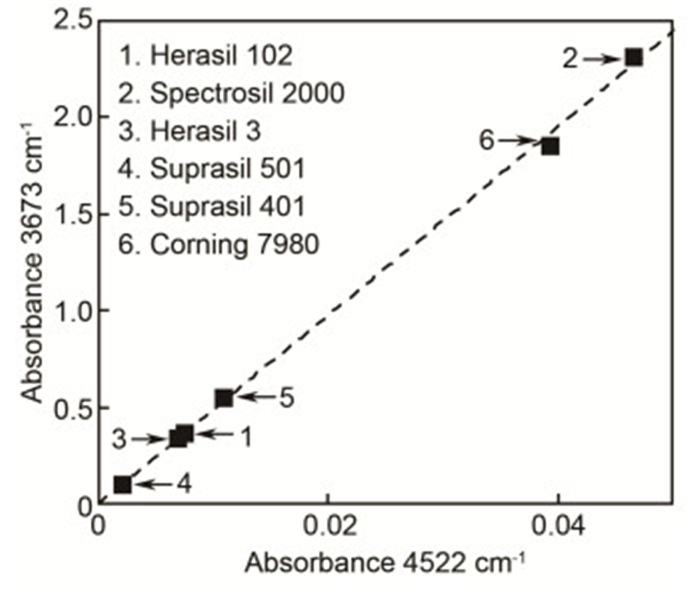
图 4 6种样品中3673 cm-1峰和4522 cm-1峰的吸光度对比图.
Figure 4. Measured absorbance values at 3673 cm-1 and 4522 cm-1 of 6 fused silica samples.

图 5 Infrasil 302样品(2.0 mm厚)在2800 cm-1~5000 cm-1波数30次测量的吸光度谱(黑色实线)和使用3050 cm-1波数吸光度分离得到的水分子吸光度谱(红色虚线).
Figure 5. Absorbance spectra for Infrasil 302 fused silica sample with 2.0 mm thickness (black line) at 2800 cm-1~5000 cm-1 wavenumber measured 30 times and H2O molecule (red dot line) resolved by absorbance at 3050 cm-1.

图 6 2.0 mm厚度时,使用4522 cm-1吸收峰(黑线)、含水吸收带的3673 cm-1吸收峰(蓝线)和去除水吸收带的3673 cm-1吸收峰(红线)测量Si—OH含量的相对均方根误差|dC/C|随Si—OH含量的变化模拟曲线,图中点为Infrasil 302,Herasil 102和Spectrosil 2000样品在3673 cm-1(红点)和4522 cm-1(黑点)吸收峰30次测量的相对误差.
Figure 6. Relative root mean square error |dC/C| of Si—OH content measured at 4522 cm-1 band (black line), 3673 cm-1 bands with water band (blue line) and 3673 cm-1 bands without water band (red line) versus Si—OH content of fused silica samples with 2.0 mm thickness, and relative errors calculated with 30 times measurements for Infrasil 302, Herasil 102 and Spectrosil 2000 samples with 2.0 mm thickness at 3673 cm-1 (red points) and 4522 cm-1 (black points).
表 1 9种2 mm熔石英样品3673 cm-1和4522 cm-1 Si—OH吸收峰的吸光度A和对应的Si—OH含量C。其中”n. d.”为未检测到.
Table 1. Absorbance A and corresponding Si—OH content C calculated via 3673 cm-1 and 4522 cm-1 absorption bands for 9 fused silica samples with 2 mm thickness. "n. d." represents not detectable.
A 3673 C3673/10-6 A 4522 C4522/10-6 Infrasil 302 0.0046±0.0003 2.4±0.2 n.d. n.d. Herasil 102 0.3623±0.0008 180.6±5.6 0.0074±0.0002 186.8±9.3 Spectrosil 2000 2.3146±0.0322 1153.9±49.5 0.0465±0.0003 1174.3±40.2 Herasil 3 0.341 170.1 0.007 172.0 HOQ 310 0.024 12.1 n.d. n.d. Suprasil 711 0.027 13.3 n.d. n.d. Suprasil 501 0.102 50.9 0.002 49.6 Suprasil 401 0.546 272.2 0.011 274.6 Corning 7980 1.853 923.7 0.039 991.5  下载: 导出CSV
-
[1] Morimoto Y, Nozawa S, Hosono H. Effect of Xe2* light (7.2 eV) on the infrared and vacuum ultraviolet absorption properties of hydroxyl groups in silica glass[J]. Physical Review B, 1999, 59(6): 4066-4073. doi: 10.1103/PhysRevB.59.4066 http://cn.bing.com/academic/profile?id=89ee7ddde16021fb46b129ad81003339&encoded=0&v=paper_preview&mkt=zh-cn
[2] Kajihara K, Skuja L, Hirano M, et al. In situ observation of the formation, diffusion, and reactions of hydrogenous species in F2-laser-irradiated SiO2 glass using a pump-and-probe technique[J]. Physical Review B, 2006, 74(9): 094202. doi: 10.1103/PhysRevB.74.094202
[3] Skuja L, Kajihara K, Hirano M, et al. Visible to vacuum-UV range optical absorption of oxygen dangling bonds in amorphous SiO2[J]. Physical Review B, 2011, 84(20): 205206. doi: 10.1103/PhysRevB.84.205206
[4] Schröder S, Kamprath M, Duparré A, et al. Bulk scattering properties of synthetic fused silica at 193 nm[J]. Optics Express, 2006, 14(22): 10537-10549. doi: 10.1364/OE.14.010537 http://cn.bing.com/academic/profile?id=1ba65587349759f19e3b4e0a76447907&encoded=0&v=paper_preview&mkt=zh-cn
[5] Kühn B, Uebbing B, Stamminger M, et al. Compaction versus expansion behavior related to the OH-content of synthetic fused silica under prolonged UV-laser irradiation[J]. Journal of Non-Crystalline Solids, 2003, 330(1-3): 23-32. doi: 10.1016/j.jnoncrysol.2003.08.063 https://www.sciencedirect.com/science/article/pii/S0022309303006331
[6] Humbach O, Fabian H, Grzesik U, et al. Analysis of OH absorption bands in synthetic silica[J]. Journal of Non-Crystalline Solids, 1996, 203(1): 19-26. https://www.sciencedirect.com/science/article/pii/0022309396003298
[7] Ebendorff-Heidepriem H, Kuan K, Oermann M R, et al. Extruded tellurite glass and fibers with low OH content for mid-infrared applications[J]. Optical Materials Express, 2012, 2(4): 432-442. doi: 10.1364/OME.2.000432 http://cn.bing.com/academic/profile?id=212279ee9beb6a70a99ad0550e806744&encoded=0&v=paper_preview&mkt=zh-cn
[8] Hild S, Lück H, Winkler W, et al. Measurement of a low-absorption sample of OH-reduced fused silica[J]. Applied Optics, 2006, 45(28): 7269-7272. doi: 10.1364/AO.45.007269 http://cn.bing.com/academic/profile?id=07e128a462ab552cfeec4c9aa0416e83&encoded=0&v=paper_preview&mkt=zh-cn
[9] Mercier M, Di Muro A, Métrich N, et al. Spectroscopic analysis (FTIR, Raman) of water in mafic and intermediate glasses and glass inclusions[J]. Geochimicaet Cosmochimica Acta, 2010, 74(19): 5641-5656. doi: 10.1016/j.gca.2010.06.020 http://cn.bing.com/academic/profile?id=26ed2261c42d8af26dc0921620e70aec&encoded=0&v=paper_preview&mkt=zh-cn
[10] Stolen R H, Walrafen G E. Water and its relation to broken bond defects in fused silica[J]. The Journal of Chemical Physics, 1976, 64(6): 2623-2631. doi: 10.1063/1.432516 http://cn.bing.com/academic/profile?id=e5f2214c7c5901a23fc36ab96f0bbc51&encoded=0&v=paper_preview&mkt=zh-cn
[11] Galeener F L, Mikkelsen Jr J C. Raman diffusion profilometry:OH in vitreous SiO2[J]. Applied Physics Letters, 1981, 38(5): 336-338. doi: 10.1063/1.92361 http://cn.bing.com/academic/profile?id=2103c8bd8dfecd464b11b05e21ec212d&encoded=0&v=paper_preview&mkt=zh-cn
[12] Davis K M, Tomozawa M. An infrared spectroscopic study of water-related species in silica glasses[J]. Journal of Non-Crystalline Solids, 1996, 201(3): 177-198. doi: 10.1016/0022-3093(95)00631-1 http://cn.bing.com/academic/profile?id=2ce63e65b02c7d5f5867ed8ade8766de&encoded=0&v=paper_preview&mkt=zh-cn
[13] DeRosa R L, Schader P A, Shelby J E. Hydrophilic nature of silicate glass surfaces as a function of exposure condition[J]. Journal of Non-Crystalline Solids, 2003, 331(1-3): 32-40. doi: 10.1016/j.jnoncrysol.2003.08.078
[14] Agrinier P, Jendrzejewski N. Overcoming problems of density and thickness measurements in FTIR volatile determinations: a spectroscopic approach[J]. Contributions to Mineralogy and Petrology, 2000, 139(3): 265-272. doi: 10.1007/s004100000141 https://link.springer.com/article/10.1007/s004100000141
[15] Davis K M, Agarwal A, Tomozawa M, et al. Quantitative infrared spectroscopic measurement of hydroxyl concentrations in silica glass[J]. Journal of Non-Crystalline Solids, 1996, 203(1): 27-36. http://cn.bing.com/academic/profile?id=efb1ebc306887c5c986351918deb764f&encoded=0&v=paper_preview&mkt=zh-cn
[16] Cremers D A, Radziemski L J. Handbook of laser-induced breakdown spectroscopy[M]. Chichester: John Wiley & Sons, 2006: 115.
-
 点击扫一扫
点击扫一扫
图(6)
表(1)
计量
- 文章访问数: 9380
- PDF下载数: 3622
- 施引文献: 0


