Convective clouds detection in satellite cloud image using fast fuzzy support vector machine
-
Abstract:
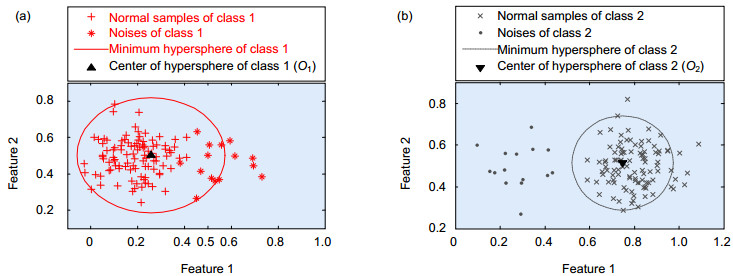
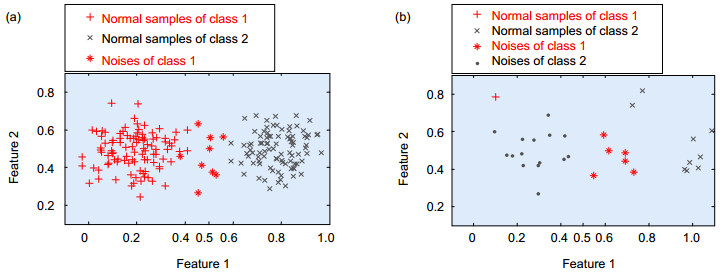
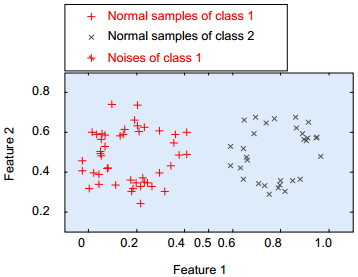
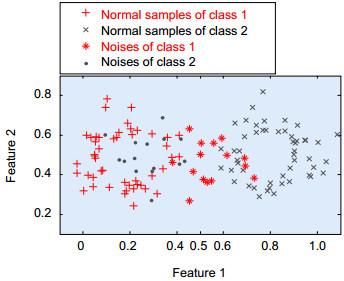
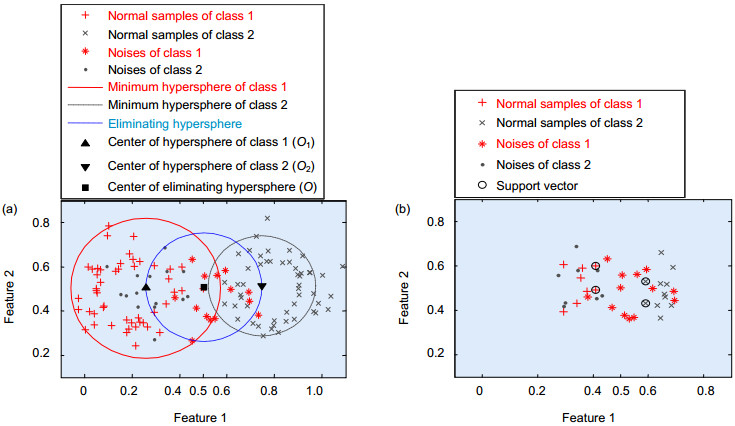
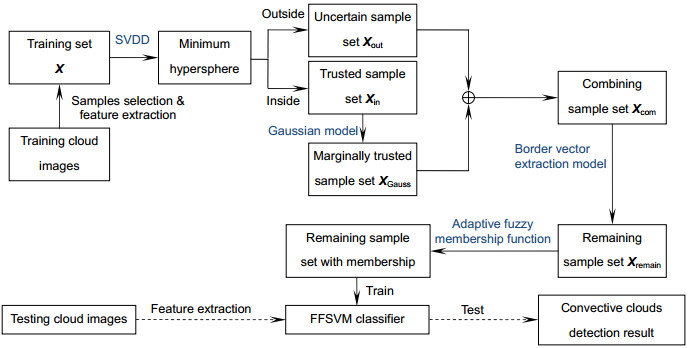
Support vector machine (SVM) is easily affected by noises and outliers, and its training time dramatically increases with the growing in number of training samples. Satellite cloud image may easily be deteriorated by noises and intensity non-uniformity with a huge amount of data needs to be processed regularly, so it is hard to detect convective clouds in satellite image using traditional SVM. To deal with this problem, a novel method for detection of convective clouds was proposed based on fast fuzzy support vector machine (FFSVM). FFSVM was constructed by eliminating feeble samples and designing new membership function as two aspects. Firstly, according to the distribution characteristics of fuzzy inseparable sample set and the fact that the classification hyper-plane is only determined by support vectors, this paper uses SVDD, Gaussian model and border vector extraction model comprehensively to design a sample selection method in three steps, which can eliminate most of redundant samples and keep possible support vectors. Then, by defining adaptive parameters related to attenuation rate and critical membership on the basis of the distribution characteristics of training set, an adaptive membership function is designed. Finally, the FFSVM is trained by the remaining samples using adaptive membership function to detect convective clouds. The experiments on FY-2D satellite images show that the proposed method, compared with traditional FSVM, not only remarkably reduces training time, but also further improves the accuracy of convective clouds detection.

-

Satellite cloud image processing is widely used in meteorology, and convective cloud attracts great attentions in meteorological monitoring. Generally speaking, convective cloud plays a pivotal role in governing the rainfall, and they are also responsible for modulating the radiation budget of earth atmosphere system. Especially, the emergence of cumulonimbus which generates at the beginning of convection is often indicating thunder and lightning, torrential rains or even accompanies typhoons and other natural disasters. Hence, the convective clouds detection is a key factor for weather forecasting, climate monitoring and helps to prevent natural disasters.
In this paper, a modified Support vector machine (SVM) was proposed to detect convective clouds. The traditional SVM is easily affected by noises and outliers, and its training time will dramatically increase with the growing in number of training samples. On the other hand, satellite cloud image may easily be deteriorated by noises and intensity non-uniformity with a huge amount of data needs to be processed regularly, so it is hard to detect convective clouds in satellite image using traditional SVM. To deal with this problem, a novel method for detection of convective clouds based on a fast fuzzy support vector machine (FFSVM) was proposed. FFSVM was constructed by eliminating feeble samples and designing new membership function as two aspects. First, according to the distribution characteristics of fuzzy inseparable sample-set and the fact that the classification hyper-plane is only determined by support vectors, this paper uses SVDD, Gaussian model and border vector extraction model comprehensively to design a sample selection method in three steps, which can eliminate most of redundant samples and keep possible support vectors. Then, by defining adaptive parameters related to attenuation rate and critical membership on the basis of the distribution characteristics of training set, an adaptive membership function is designed. Finally, the FFSVM was trained by the remaining samples using adaptive membership function to detect convective clouds. The experiments on FY-2D satellite images show that the proposed method, compared with traditional FSVM where no samples were eliminated, not only remarkably reduces training time, but also further improves the accuracy of convective clouds detection.
-

-
Table 1. The number of training samples of each group experiment.
Group number The number of training samples BG CC Total 1 50 50 100 2 100 100 200 3 200 200 400 4 300 300 600 5 400 400 800 6 500 500 1000 7 600 600 1200 8 700 700 1400 9 800 800 1600 10 900 900 1800 Table 2. The experimental results of traditional FSVM for each group experiment.
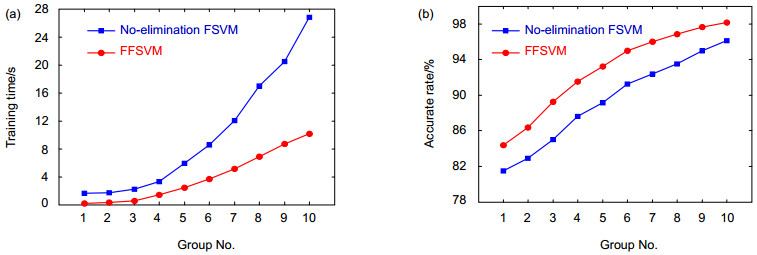
Group number Number of training samples (BG/CC) Number of support vectors(BG/CC) Training time/s Number of accurate samples(BG/CC) Accuracy/(%) 1 100(50/50) 22(18/4) 1.623 652(252/400) 81.50 2 200(100/100) 52(44/8) 1.684 663(263/400) 82.88 3 400(200/200) 88(81/7) 2.218 680 (280/400) 85.00 4 600(300/300) 124(116/8) 3.307 701 (301/400) 87.63 5 800(400/400) 144(136/8) 5.931 713 (313/400) 89.13 6 1000(500/500) 171(160/11) 8.533 730(330/400) 91.25 7 1200(600/600) 189(177/12) 12.014 739(339/400) 92.38 8 1400(700/700) 205(193/12) 16.997 748(348/400) 93.50 9 1600(800/800) 223(210/13) 20.486 760(360/400) 95.00 10 1800(900/900) 247(233/14) 26.815 769(369/400) 96.13 Table 3. The experimental results of fast FSVM for each group experiment.
Group number Number of remaining training samples (BG/CC) Eliminating rate/(%) Number of support vectors(BG/CC) Training time/s Saving time/s Number of accurate samples (BG/CC) Accuracy/% 1 25(18/7) 25.00 18(13/5) 0.180 1.443 675 (275/400) 84.38 2 50(28/22) 25.00 30(21/9) 0.301 1.383 691 (291/400) 86.38 3 115(76/39) 28.75 56(47/9) 0.557 1.661 714 (314/400) 89.25 4 183(124/59) 30.50 76(65/11) 1.444 1.863 732 (332/400) 91.50 5 243(158/85) 30.38 80(68/12) 2.449 3.482 746(346/400) 93.25 6 315(203/112) 31.50 98(85/13) 3.651 4.882 760(360/400) 95.00 7 389(/259/130) 32.41 112(98/14) 5.117 6.897 768(368/400) 96.00 8 460(305/155) 32.85 121(117/14) 6.884 10.113 775(375/400) 96.88 9 529(350/179) 33.06 136(121/15) 8.692 11.794 781(381/400) 97.63 10 601(397/204) 33.39 152(146/16) 10.131 16.684 785(785/400) 98.13 -
[1] Chen Lin, Hu Xiuqing, Xu Na, et al. The application of deep convective clouds in the calibration and response monitoring of the reflective solar bands of FY-3A/MERSI (medium resolution spectral imager)[J]. Remote Sensing, 2013, 5(12): 6958-6975. doi: 10.3390/rs5126958 http://cn.bing.com/academic/profile?id=77bbd461b93385a92770b78ef1ccfa79&encoded=0&v=paper_preview&mkt=zh-cn
[2] Wang Wenhui, Cao Changyong. Monitoring the NOAA operational VIIRS RSB and DNB calibration stability using monthly and semi-monthly deep convective clouds time series[J]. Remote Sensing, 2016, 8(1): 32. doi: 10.3390/rs8010032 http://cn.bing.com/academic/profile?id=48ae152a1e815e5d1e0273936aae8724&encoded=0&v=paper_preview&mkt=zh-cn
[3] Seiki T, Nakajima T. Aerosol effects of the condensation process on a convective cloud simulation[J]. Journal of the Atmospheric Sciences, 2014, 71(2): 833-853. doi: 10.1175/JAS-D-12-0195.1 http://cn.bing.com/academic/profile?id=c116ea2f334fc65cc5e28cc4da3a5be2&encoded=0&v=paper_preview&mkt=zh-cn
[4] Yan Wen, Gong Fei, Zhou Ying, et al. Satellite cloud image fusion based on adaptive PCNN and NSST[J]. Opto-Electronic Engineering, 2016, 43(10): 70-76, 83. (in Chinese) http://www.gdgc.ac.cn/EN/abstract/abstract1801.shtml
[5] Zhou Ying, Fu Randi, Yan Wen, et al. A method of infrared nephogram super-resolution based on structural group sparse representation[J]. Opto-Electronic Engineering, 2016, 43(12): 126-132. (in Chinese) http://www.oee.ac.cn/EN/abstract/abstract1855.shtml
[6] Tapakis R, Charalambides A G. Equipment and methodologies for cloud detection and classification: a review[J]. Solar Energy, 2013, 95: 392-430. doi: 10.1016/j.solener.2012.11.015 https://www.sciencedirect.com/science/article/pii/S0038092X12004069
[7] Roca R, Ramanathan V. Scale dependence of monsoonal convective systems over the Indian ocean[J]. Journal of Climate, 2000, 13(7): 1286-1298. doi: 10.1175/1520-0442(2000)013<1286:SDOMCS>2.0.CO;2 http://cn.bing.com/academic/profile?id=c7329fceb71f463d18c39affe131013a&encoded=0&v=paper_preview&mkt=zh-cn
[8] Fiolleau T, Roca R. An algorithm for the detection and tracking of tropical mesoscale convective systems using infrared images from geostationary satellite[J]. IEEE Transactions on Geoscience and Remote Sensing, 2013, 51(7): 4302-4315. doi: 10.1109/TGRS.2012.2227762 http://cn.bing.com/academic/profile?id=db1296d9d7d84d3314f7305ef0c5bbf4&encoded=0&v=paper_preview&mkt=zh-cn
[9] Liu Yanan, Wei Ming, Gao Wei, et al. Short-term automatic forecast algorithm of severe convective cloud identification using FY-2 IR images[J]. Journal of Remote Sensing, 2012, 16(1): 79-92. http://cn.bing.com/academic/profile?id=f47563d321816b3e2350f47d74d83955&encoded=0&v=paper_preview&mkt=zh-cn
[10] Shukla B P, Pal P K. A source apportionment approach to study the evolution of convective cells: an application to the nowcasting of convective weather systems[J]. IEEE Journal of Selected Topics in Applied Earth Observations and Remote Sensing, 2012, 5(1): 242-247. doi: 10.1109/JSTARS.2011.2170661 http://cn.bing.com/academic/profile?id=523db119c4c8ce2cc1f9f7b423b902af&encoded=0&v=paper_preview&mkt=zh-cn
[11] Georgiev C G, Kozinarova G. Usefulness of satellite water vapour imagery in forecasting strong convection: a flash-flood case study[J]. Atmospheric Research, 2009, 93(1-3): 295-303. doi: 10.1016/j.atmosres.2008.09.036 http://cn.bing.com/academic/profile?id=73f17dd055b49642d9b65f673cc77225&encoded=0&v=paper_preview&mkt=zh-cn
[12] Liu C C, Shyu T Y, Chao C C, et al. Analysis on typhoon Longwang intensity changes over the ocean via satellite data[J]. Journal of Marine Science and Technology, 2009, 17(1): 23-28. https://www.researchgate.net/publication/285816441_Analysis_on_Typhoon_Longwang_intensity_changes_over_the_ocean_via_satellite_data
[13] Goswami B, Bhandari G, Goswami, S. Fuzzy min-max neural network for satellite infrared image clustering[C]// Proceedings of the 3rd International Conference on Emerging Applications of Information Technology, Kolkata, India, 2012: 239-242.
https://ieeexplore.ieee.org/document/6407913/ [14] Liu Yu, Xia Jun, Shi Chunxiang, et al. An improved cloud classification algorithm for China's FY-2C multi-channel images using artificial neural network[J]. Sensors, 2009, 9(7): 5558-5579. doi: 10.3390/s90705558 http://cn.bing.com/academic/profile?id=b83d131b3716b6854aa73f244b66ce9e&encoded=0&v=paper_preview&mkt=zh-cn
[15] Chorowski J, Wang Jian, Zurada J M. Review and performance comparison of SVM-and ELM-based classifiers[J]. Neurocomputing, 2014, 128: 507-516. doi: 10.1016/j.neucom.2013.08.009 http://cn.bing.com/academic/profile?id=2b43167d7d81dcc900684d2b4d52311a&encoded=0&v=paper_preview&mkt=zh-cn
[16] Xu Jinwei, Wang Ping, Xie Yiyang. Image segmentation of typhoon spiral cloud bands based on support vector machine[C]// Proceedings of 2009 IEEE International Conference on Machine Learning and Cybernetics, Baoding, Hebei, 2009: 1088-1093.
https://ieeexplore.ieee.org/document/5212398/ [17] Lin Chunfu, Wang Shengde. Fuzzy support vector machines[J]. IEEE Transactions on Neural Networks, 2002, 13(2): 464-471. doi: 10.1109/72.991432 http://cn.bing.com/academic/profile?id=db6223ee017b587279450f0d57d85e93&encoded=0&v=paper_preview&mkt=zh-cn
[18] An Wenjuan, Liang Mangui. Fuzzy support vector machine based on within-class scatter for classification problems with outliers or noises[J]. Neurocomputing, 2013, 110: 101-110. doi: 10.1016/j.neucom.2012.11.023 https://dl.acm.org/citation.cfm?id=2464335
[19] Fu Randi, Tian Wenzhe, Jin Wei, et al. Fuzzy support vector machines for cumulus cloud detection[J]. Opto-Electronic Engineering, 2014, 41(11): 29-35. (in Chinese) https://dl.acm.org/citation.cfm?id=2464335
[20] Lee Y J, Huang Suyun. Reduced support vector machines: a statistical theory[J]. IEEE Transactions on Neural Networks, 2007, 18(1): 1-13. https://www.researchgate.net/profile/Yuh-Jye_Lee/publication/6527210_Reduced_Support_Vector_Machines_A_Statistical_Theory/links/0a85e53c5b55875970000000.pdf
[21] Li Boyang, Wang Qiangwei, Hu Jinglu. A fast SVM training method for very large datasets[C]// Proceedings of 2009 IEEE International Joint Conference on Neural Networks, Atlanta, GA, USA, 2009: 1784-1789.
[22] Yu Zhiwen, Wong H S, Wen Guihua. A modified support vector machine and its application to image segmentation[J]. Image and Vision Computing, 2011, 29(1): 29-40. doi: 10.1016/j.imavis.2010.08.003 http://cn.bing.com/academic/profile?id=801224d4725b47413cac607f188cf1e9&encoded=0&v=paper_preview&mkt=zh-cn
[23] Tax D M J, Duin R P W. Support vector data description[J]. Machine Learning, 2004, 54(1): 45-66. doi: 10.1023/B:MACH.0000008084.60811.49 http://cn.bing.com/academic/profile?id=7d07cdc69c173249a1beaca75f0373ec&encoded=0&v=paper_preview&mkt=zh-cn
[24] Jin Wei, Gong Fei, Zeng Xingbin, et al. Classification of clouds in satellite imagery using adaptive fuzzy sparse representation[J]. Sensors, 2016, 16(12): 2153. doi: 10.3390/s16122153 https://www.ncbi.nlm.nih.gov/pubmed/27999261
-


 E-mail Alert
 RSS
RSS
 下载:
下载:
