
 E-mail Alert
 RSS
RSS
Image super-resolution reconstruction by fusing feature classification and independent dictionary training
-
摘要:
超分辨率重建技术在重构图像细节、改善图像视觉效果方面具有重要作用。为进一步提高图像的重建质量,提出了一种有效的超分辨率重建方法。首先提取图像块的几何特征来构造决策树,以期通过监督的方式进行图像块分类。然后针对不同类型的图像块训练集,分别基于K-SVD独立训练相应的高分辨率字典和低分辨率字典。最后为了保证图像块的准确和快速重建,对高分辨率训练集和低分辨率训练集的系数求解映射矩阵,其用于在重建阶段将低分辨率稀疏系数映射为高分辨率稀疏系数以达到重建目的。实验结果表明,本文的方法与其他经典的超分辨率重建方法相比,在重建效果方面具有明显提高。
Abstract:Super-resolution reconstruction plays an important role in reconstructing image detail and improving image visual effects. A new effective super-resolution method is proposed. Firstly, we extract the geometric features of the image patch to construct the decision tree, which will be used in patch classification in a supervised way. Then, we train the high-resolution and low-resolution dictionaries based on K-SVD independently for different types of training sets. Finally, we solve the mapping matrix for the coefficients between the high-resolution and low-resolution training set, which are used to map the low-resolution coefficients to high-resolution coefficients during the reconstruction phase to ensure accurate and fast reconstruction of the image patches. The experimental results show that the proposed method has a significant improvement in the reconstruction effect compared with other classic methods.
-
Key words:
- super-resolution /
- dictionary training /
- sparse coding /
- decision tree /
- feature classification
-

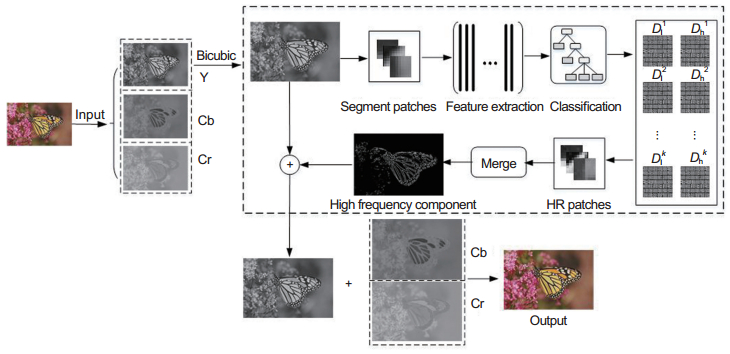
Overview: Super-resolution reconstruction plays an important role in reconstructing image detail and improving image visual effects. It aims at reconstructing a high-resolution image from one or multiple low-resolution images. Because the high-resolution image contains more details than the low-resolution image, the high-resolution image possesses more values in remote sensing, medical diagnostic and so on. The super-resolution reconstruction can be divided into three categories: interpolation-based methods, reconstruction-based methods and learning-based methods. Because the learning-based methods can generate high-frequency details which are not available in the low-resolution, it attracts the attention of many researchers, and gradually becomes the main method of super-resolution reconstruction. We proposed a new effective super-resolution method based on the classification reconstruction and independent dictionary training. Most of the current classification of reconstruction methods are based on kmeans, but it tend to be difficult to further improve quality of reconstruction images due to the way of unsupervised clustering. So we analyze different image patches and three features including variance, and gradient feature, which are used to generate the decision tree for classification. Variance is used to distinguish smooth patches and other patches, gradient feature is used to distinguish stochastic patches and direction patches, and the last one is used to further distinguish directions. The experimental results show that our classification method has better classification results than kmeans. On the other hand, we train the high and low-resolution dictionaries based on K-SVD independently for different types of training sets. However, there is an obvious difference between the low-resolution coefficient and the high-resolution coefficient due to the independent dictionary training. Although the dictionary can represent respective training set well, the reconstructed images tend to be inferior if we insist on replacing the high-resolution coefficient using the low-resolution one. So it is necessary to solve their mapping function in order to achieve the better reconstruction effect. The mapping function is used to map the low-resolution coefficients to high-resolution coefficients during the reconstruction phase to ensure accurate and fast reconstruction of the image patches. We show the experimental results in detail when the magnification is 3, the experiment with different magnification and the comparative experiment with K-means. In general, the experimental results show that the proposed method has a significant improvement in the reconstruction effect compared with other classic methods.
-

-
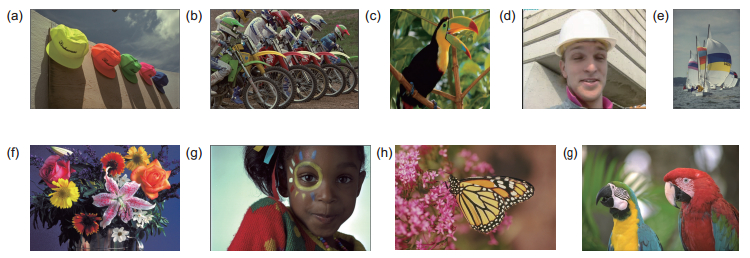
图 3 图像集。(a)帽子;(b)比赛;(c)鸟;(d)工长;(e)帆船;(f)花;(g)女孩;(h)蝴蝶;(i)鹦鹉
Figure 3. Image set. (a) Hats; (b) Match; (c) Bird; (d) Foreman; (e) Sailboats; (f) Flowers; (g) Girl; (h) Butterfly; (i) Parrots
表 1 图像放大3倍的重建结果数据表
Table 1. The experimental results with magnification 3
Image Evaluation Bicubic Yang Zeyde NE+LLE NE+NNLS ANR Proposed hats PSNR 32.07 33.11 33.50 33.29 33.24 33.24 33.88 SSIM 0.8799 0.8900 0.9031 0.9004 0.8991 0.9002 0.9083 VIF 0.4633 0.4688 0.5723 0.5671 0.5574 0.5664 0.5956 FISM 0.8886 0.9055 0.9196 0.9161 0.9142 0.9153 0.9257 match PSNR 23.39 24.17 24.19 24.22 24.14 24.26 24.51 SSIM 0.6479 0.7081 0.7052 0.7091 0.7006 0.7117 0.7229 VIF 0.2965 0.3287 0.3565 0.3596 0.3501 0.3634 0.3755 FISM 0.7823 0.8246 0.8215 0.8247 0.8183 0.8265 0.8347 sailboats PSNR 28.16 28.94 28.95 28.83 28.74 28.84 29.17 SSIM 0.8390 0.8559 0.8635 0.8597 0.8582 0.8598 0.8686 VIF 0.3759 0.3656 0.4465 0.4437 0.4354 0.4458 0.4599 FISM 0.8513 0.8717 0.8758 0.8705 0.8684 0.8691 0.8800 girl PSNR 30.37 31.33 32.21 31.82 31.71 31.76 32.31 SSIM 0.8734 0.8694 0.8906 0.8868 0.8821 0.8867 0.8927 VIF 0.4424 0.4358 0.5315 0.5292 0.5203 0.5333 0.5483 FISM 0.8950 0.8944 0.9215 0.9148 0.9114 0.9126 0.9206 parrots PSNR 30.66 31.23 31.40 31.40 31.31 31.43 31.77 SSIM 0.9042 0.9056 0.9181 0.9182 0.9154 0.9190 0.9216 VIF 0.5170 0.4733 0.5914 0.5952 0.5820 0.5981 0.6037 FISM 0.9323 0.9350 0.9452 0.9453 0.9421 0.9457 0.9482 bird PSNR 32.58 34.11 34.51 34.50 34.23 34.53 35.08 SSIM 0.9256 0.9391 0.9476 0.9474 0.9429 0.9485 0.9522 VIF 0.5504 0.5842 0.6555 0.6576 0.6399 0.6637 0.6725 FISM 0.9283 0.9449 0.9498 0.9493 0.9450 0.9502 0.9548 flowers PSNR 27.23 28.25 28.42 28.35 28.21 28.45 28.68 SSIM 0.8013 0.8297 0.8376 0.8377 0.8327 0.8396 0.8436 VIF 0.3683 0.3988 0.4467 0.4463 0.4365 0.4516 0.4613 FISM 0.8445 0.8713 0.8760 0.8745 0.8699 0.8764 0.8818 foreman PSNR 31.18 32.04 33.16 33.10 32.94 33.15 33.72 SSIM 0.9058 0.9132 0.9294 0.9284 0.9251 0.9292 0.9355 VIF 0.5309 0.5326 0.6348 0.6392 0.6222 0.6449 0.6605 FISM 0.9123 0.9287 0.9385 0.9383 0.9349 0.9388 0.9455 butterfly PSNR 29.43 30.71 31.09 30.89 30.74 31.02 31.63 SSIM 0.9198 0.9290 0.9380 0.9357 0.9339 0.9371 0.9423 VIF 0.4600 0.4576 0.5461 0.5457 0.5318 0.5513 0.5658 FISM 0.9658 0.9750 0.9820 0.9808 0.9799 0.9816 0.9856 average PSNR 29.45 30.43 30.83 30.71 30.58 30.74 31.19 SSIM 0.8552 0.8711 0.8815 0.8804 0.8767 0.8813 0.8875 VIF 0.4450 0.4495 0.5312 0.5315 0.5195 0.5354 0.5492 FISM 0.8889 0.9057 0.9144 0.9127 0.9094 0.9129 0.9196  下载: 导出CSV
表 2 不同放大倍数实验结果数据表
Table 2. The experimental results with different magnifications
Scale Evaluation Bicubic Yang Zeyde NE+LLE NE+NNLS ANR Proposed x2 PSNR 32.33 26.08 34.35 34.31 34.07 34.36 34.57 SSIM 0.9205 0.9128 0.9421 0.9421 0.9402 0.9432 0.9441 VIF 0.6484 0.5985 0.7574 0.7605 0.7496 0.7639 0.7656 FISM 0.9406 0.9184 0.9613 0.9612 0.9596 0.9614 0.9633 x3 PSNR 29.45 30.43 30.83 30.71 30.58 30.74 31.19 SSIM 0.8552 0.8711 0.8815 0.8804 0.8767 0.8813 0.8875 VIF 0.4450 0.4495 0.5312 0.5315 0.5195 0.5354 0.5492 FISM 0.8889 0.9057 0.9144 0.9127 0.9094 0.9129 0.9196 x4 PSNR 27.86 27.84 28.98 28.86 28.77 28.92 29.29 SSIM 0.8028 0.7986 0.8297 0.8278 0.8248 0.8295 0.8372 VIF 0.3189 0.2881 0.3888 0.3893 0.3800 0.3935 0.4044 FISM 0.8490 0.8527 0.8755 0.8732 0.8706 0.8744 0.8826
下载: 导出CSV
表 3 与K-means分类对比的实验数据
Table 3. The experimental results compared with K-means
Type Evaluation Hats Pparrots Bird Foreman Butterfly Average Kmeans PSNR 33.52 31.47 34.73 33.34 31.36 32.88 SSIM 0.9035 0.9191 0.9492 0.9311 0.9396 0.9285 VIF 0.5784 0.5999 0.6675 0.6460 0.5626 0.6109 FISM 0.9210 0.9465 0.9520 0.9417 0.9838 0.9490 Proposed PSNR 33.88 31.77 35.08 33.72 31.63 33.22 SSIM 0.9083 0.9216 0.9522 0.9355 0.9371 0.9310 VIF 0.5956 0.6037 0.6725 0.6605 0.5658 0.6196 FISM 0.9257 0.9482 0.9548 0.9455 0.9856 0.9520
下载: 导出CSV
表 4 本文算法关于时间方面实验
Table 4. The experiment about time of the proposed algorithm
Bicubic Yang Zeyde NE+LLE NE+NNLS ANR Proposed Time 0.00 40.53 1.56 3.03 14.23 0.64 7.62
下载: 导出CSV
-
[1] Wang L Z, Lu K, Liu P. Compressed sensing of a remote sensing image based on the priors of the reference image[J]. IEEE Geoscience and Remote Sensing Letters, 2015, 12(4): 736-740. doi: 10.1109/LGRS.2014.2360457
[2] Wang Y H, Li J B, Fu P. Medical image super-resolution analysis with sparse representation[C]//Proceedings of the 2012 Eighth International Conference on Intelligent Information Hiding and Multimedia Signal Processing, 2012: 106-109.
[3] Li X, Orchard M T. New edge-directed interpolation[J]. IEEE Transactions on Image Processing, 2001, 10(10): 1521-1527. doi: 10.1109/83.951537
[4] Zhang L, Wu X L. An edge-guided image interpolation algorithm via directional filtering and data fusion[J]. IEEE Transactions on Image Processing, 2006, 15(8): 2226-2238. doi: 10.1109/TIP.2006.877407
[5] Dai S Y, Han M, Xu W, et al. SoftCuts: a soft edge smoothness prior for color image super-resolution[J]. IEEE Transactions on Image Processing, 2009, 18(5): 969-981. doi: 10.1109/TIP.2009.2012908
[6] Sun J, Shum H Y. Image super-resolution using gradient profile prior: US 2010/0086227 A1[P]. 2010-04-08.
[7] Yang J C, Wright J, Huang T, et al. Image super-resolution as sparse representation of raw image patches[C]//Proceedings of the 2008 IEEE Conference on Computer Vision and Pattern Recognition, IEEE, 2008: 1-8.
[8] Yang J C, Wright J, Huang T S, et al. Image super-resolution via sparse representation[J]. IEEE Transactions on Image Processing, 2010, 19(11): 2861-2873. doi: 10.1109/TIP.2010.2050625
[9] Yang J C, Wang Z W, Lin Z, et al. Coupled dictionary training for image super-resolution[J]. IEEE Transactions on Image Processing, 2012, 21(8): 3467-3478. doi: 10.1109/TIP.2012.2192127
[10] Xu J, Qi C, Chang Z G. Coupled K-SVD dictionary training for super-resolution[C]//Proceedings of the 2014 IEEE International Conference on Image Processing, 2014: 3910-3914.
[11] Zeyde R, Elad M, Protter M. On single image scale-up using sparse-representations[C]//Proceedings of the 7th International Conference on Curves and Surfaces, 2010: 711-730.
https://link.springer.com/chapter/10.1007/978-3-642-27413-8_47 [12] Timofte R, De V, Van G L. Anchored neighborhood regression for fast example-based super-resolution[C]//Proceedings of the 2013 IEEE International Conference on Computer Vision, 2013: 1920-1927.
[13] Timofte R, De S V, Van G L. A+: adjusted anchored neighborhood regression for fast super-resolution[C]//Proceedings of the 12th Asian Conference on Computer Vision, 2014: 111-126.
https://link.springer.com/10.1007/978-3-319-16817-3_8 [14] Aharon M, Elad M, Bruckstein A. rmK-SVD: an algorithm for designing overcomplete dictionaries for sparse representation[J]. IEEE Transactions on Signal Processing, 2006, 54(11): 4311-4322. doi: 10.1109/TSP.2006.881199
[15] Yang W M, Tian Y P, Zhou F, et al. Consistent coding scheme for single-image super-resolution via independent dictionaries[J]. IEEE Transactions on Multimedia, 2016, 18(3): 313-325. doi: 10.1109/TMM.2016.2515997
[16] Yang S Y, Liu Z Z, Wang M, et al. Multitask dictionary learning and sparse representation based single-image super-resolution reconstruction[J]. Neurocomputing, 2011, 74(17): 3193-3203. doi: 10.1016/j.neucom.2011.04.014
[17] Dong W S, Li X, Zhang L, et al. Sparsity-based image denoising via dictionary learning and structural clustering[C]//Proceedings of the 2011 IEEE Conference on Computer Vision and Pattern Recognition, 2011: 457-464.
[18] Feng X G, Milanfae P. Multiscale principal components analysis for image local orientation estimation[C]//Conference Record of the 36th Asilomar Conference on Signals, Systems and Computers, 2002, 1: 478-482.
http://ieeexplore.ieee.org/abstract/document/1197228/ [19] Chang H, Yeung D Y, Xiong Y M. Super-resolution through neighbor embedding[C]//Proceedings of the 2004 IEEE Computer Society Conference on Computer Vision and Pattern Recognition, 2004: Ⅰ.
http://ieeexplore.ieee.org/abstract/document/1315043/ [20] Bevilacqua M, Roumy A, Guillemot C, et al. Low-complexity single-image super-resolution based on nonnegative neighbor embedding[C]//Proceedings of British Machine Vision Conference (BMVC), 2012.
http://eprints.imtlucca.it/2412/ [21] Wang Z, Bovik A C, Sheikh H R, et al. Image quality assessment: from error visibility to structural similarity[J]. IEEE Transactions on Image Processing, 2004, 13(4): 600-612. doi: 10.1109/TIP.2003.819861
[22] Sheikh H R, Bovik A C. Image information and visual quality[J]. IEEE Transactions on Image Processing, 2006, 15(2): 430-444. doi: 10.1109/TIP.2005.859378
[23] Zhang L, Zhang L, Mou X Q, et al. FSIM: a feature similarity index for image quality assessment[J]. IEEE Transactions on Image Processing, 2011, 20(8): 2378-2386. doi: 10.1109/TIP.2011.2109730
-

 点击扫一扫
点击扫一扫
图(3)
表(4)
计量
- 文章访问数: 7385
- PDF下载数: 3436
- 施引文献: 0


